3.1 Toll net revenues in selected countries, 2010-2020 (EUR million)
| 2010 | 2011 | 2012 | 2013 | 2014 | 2015 | 2018 | 2019 | 2020 | |
| DK | 454,0 | 472.00 | 492,0 | 507,0 | 537,0 | 559,0 | 576 | 587 | 479 |
| EL | 565,0 | 530.00 | 516,0 | 516,0 | 469,0 | 495,0 | 659,61 | 687,34 | 557,93 |
| ES | 1820,6 | 1,808.7 | 1623,8 | 1565,0 | 1608,6 | 1709,3 | 1826,23 | 1854,49 | 1023,35 |
| FR | 7775,6 | 8,442.6 | 8450,0 | 9170 (1) | 9222,4 | 9160,0 | 10.223,00 | 10603,24 | 8734,42 |
| IE | 184,0 | 184.00 | 193,0 | 200,0 | 217,0 | 217,0 | 217 | 223,8 | 177,07 |
| IT | 4835,9 | 4,971.00 | 4804,5 | 4914,0 | 5176,9 | 5454,9 | 6.151,51( | 5016,95 | 3694,5 |
| NL | 27.21 | 28.49 | 26,8 | 26,5 | 27,7 | 28,3 | 35,4 | 36,3 | 28,7 |
| AT | 1,535.50 | 1,561.00 | 1622,1 | 1687,0 | 1826,0 | 1840,0 | 2.156,00 | 2238,6 | 2084,7 |
| PT | 725.31 | 693.43 | 627,8 | 812,5 | 855,4 | 915,6 | 1.113,89 | 1205,48 | 918,31 |
| HU | 145.50 | 167.90 | 167,9 | 189,2 | 677,6 | 677,6 | 755,6 | 855,51 | — |
| SI | 290.10 | 298.34 | 294,9 | 305,0 | 344,2 | 349,9 | 451,5 | 466,61 | 387 |
| HR | 267.40 | 272.34 | 282,8 | 296,69 (2) | 297,1 | 317,3 | 406,15 | 425,74 | 286,64 |
| PL | 189.3 | 148.25 | 157,0 | 179,6 (3) | 185,9 | 209,0 | 270 | 274,3 | 292,2 |
| UK | 70.1 | 64.40 | 71,6 | 77,6 | 83,3 | 102,0 | 101,35 | 105,2 | 57,4 |
| CZ | 262.8 | 325.00 | 346,5 | 342,2 (4) | 316,0 | 360,2 | 419 | 419 | — |
| DE | 4,484.00 | 4,498.00 | 4364,0 | 4400,0 | 4460,0 | 4370,0 | 5.165,90 | 7144,3 | 7393,79 |
| RF | — | — | — | 29,3 | 75,2 | 55,5 | — | — | — |
| SK | 175.3 | 199.88 | 151,3 | 158,63 (5) | 113,7 | 119,6 | 289,68 | 300,4 | 282,34 |
Source: ASECAP
Data at 31.12.2020
3.2 Budget managed by CINEA (total 52 billion) *
* data for Innovation Fund and Horizon Europe is “up to”
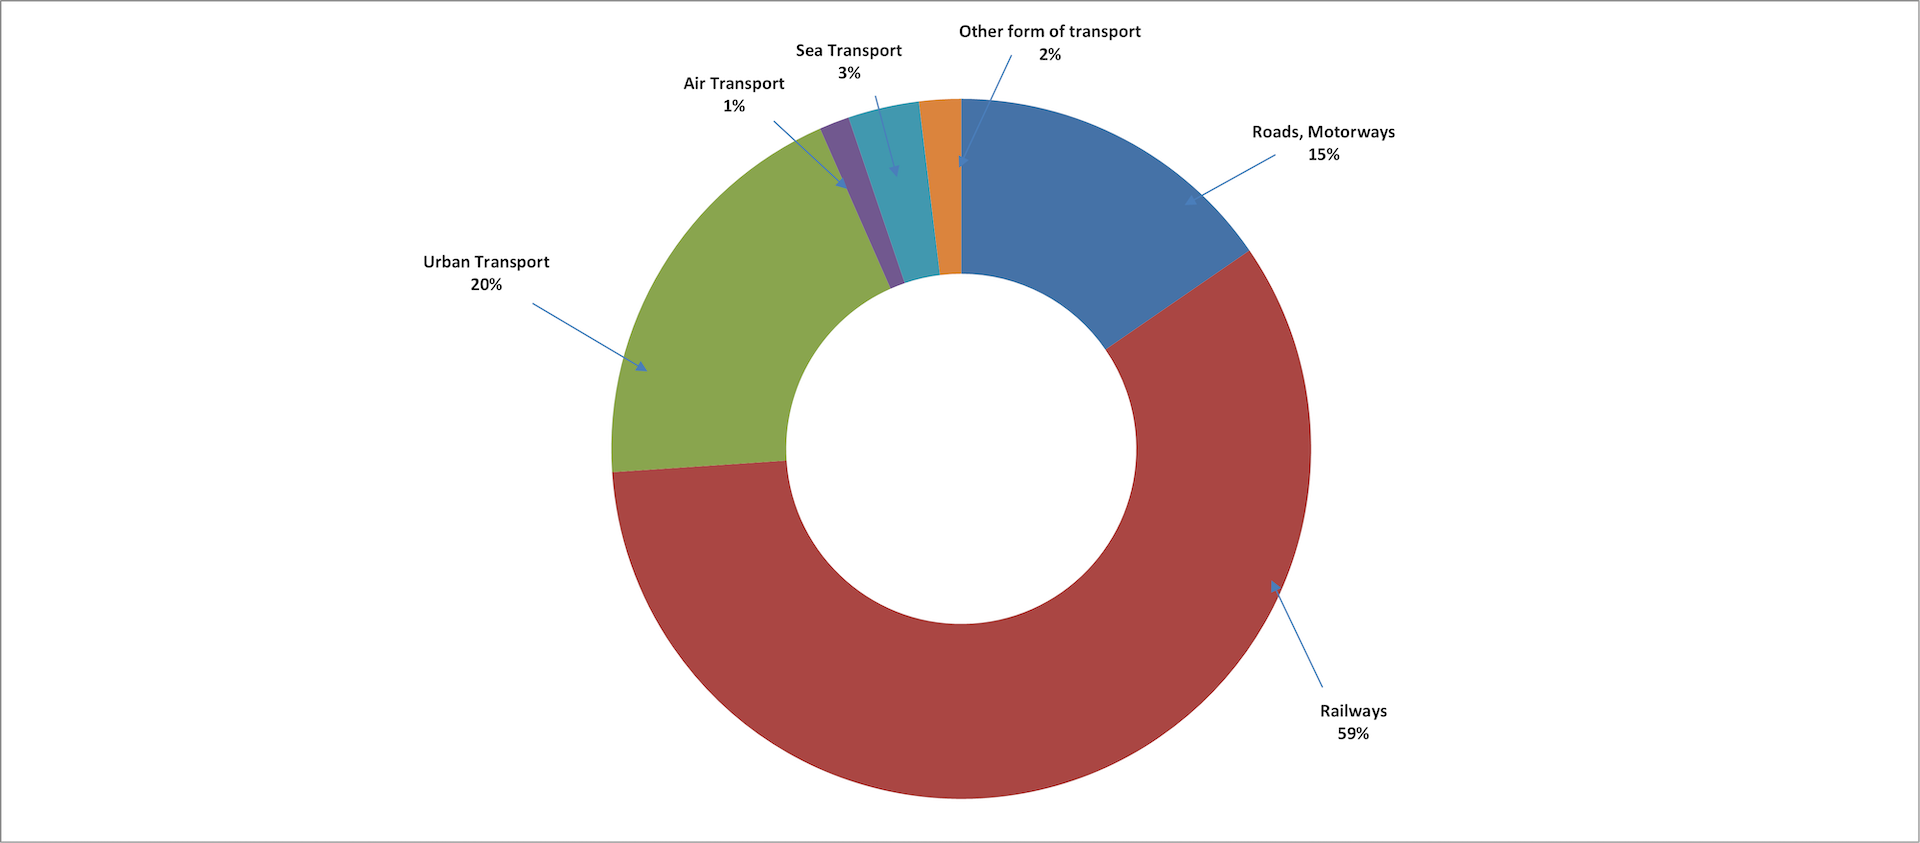
3.3 European Investment Bank Loans for Transport to EU 28, 2017-2021 (EUR million)
| 2021 | 2017-2021 | |
| Roads, Motorways | 1438 | 8852 |
| Railways | 5463 | 18523 |
| Urban Transport | 1815 | 10929 |
| Air Transport | 130 | 3939 |
| Sea Transport | 307 | 1642 |
| Intermodal Freight Terminals and Other | n.a. | 91 |
| Sundry Transport Infrastructure | n.a. | 11 |
| Other form of transport | 43 | 264 |
| Space Transport | 137 | 237 |
| Transport | n.a. | 334 |
| Total Transport Sector | 9.333 | 44.822 |
Source: EIB
3.4 European Investment Bank Loans for Transport to EU 28, 2021 (total € 9 333 million)
Source: EIB
3.5 World Bank* Total Transport Commitments , 2018-2021 ($ MILLIONS OF DOLLARS)
Source: World Bank
Notes: Numbers may not add to totals because of rounding. As of fiscal 2017, new sector categories
* IBDR +IDA commitments
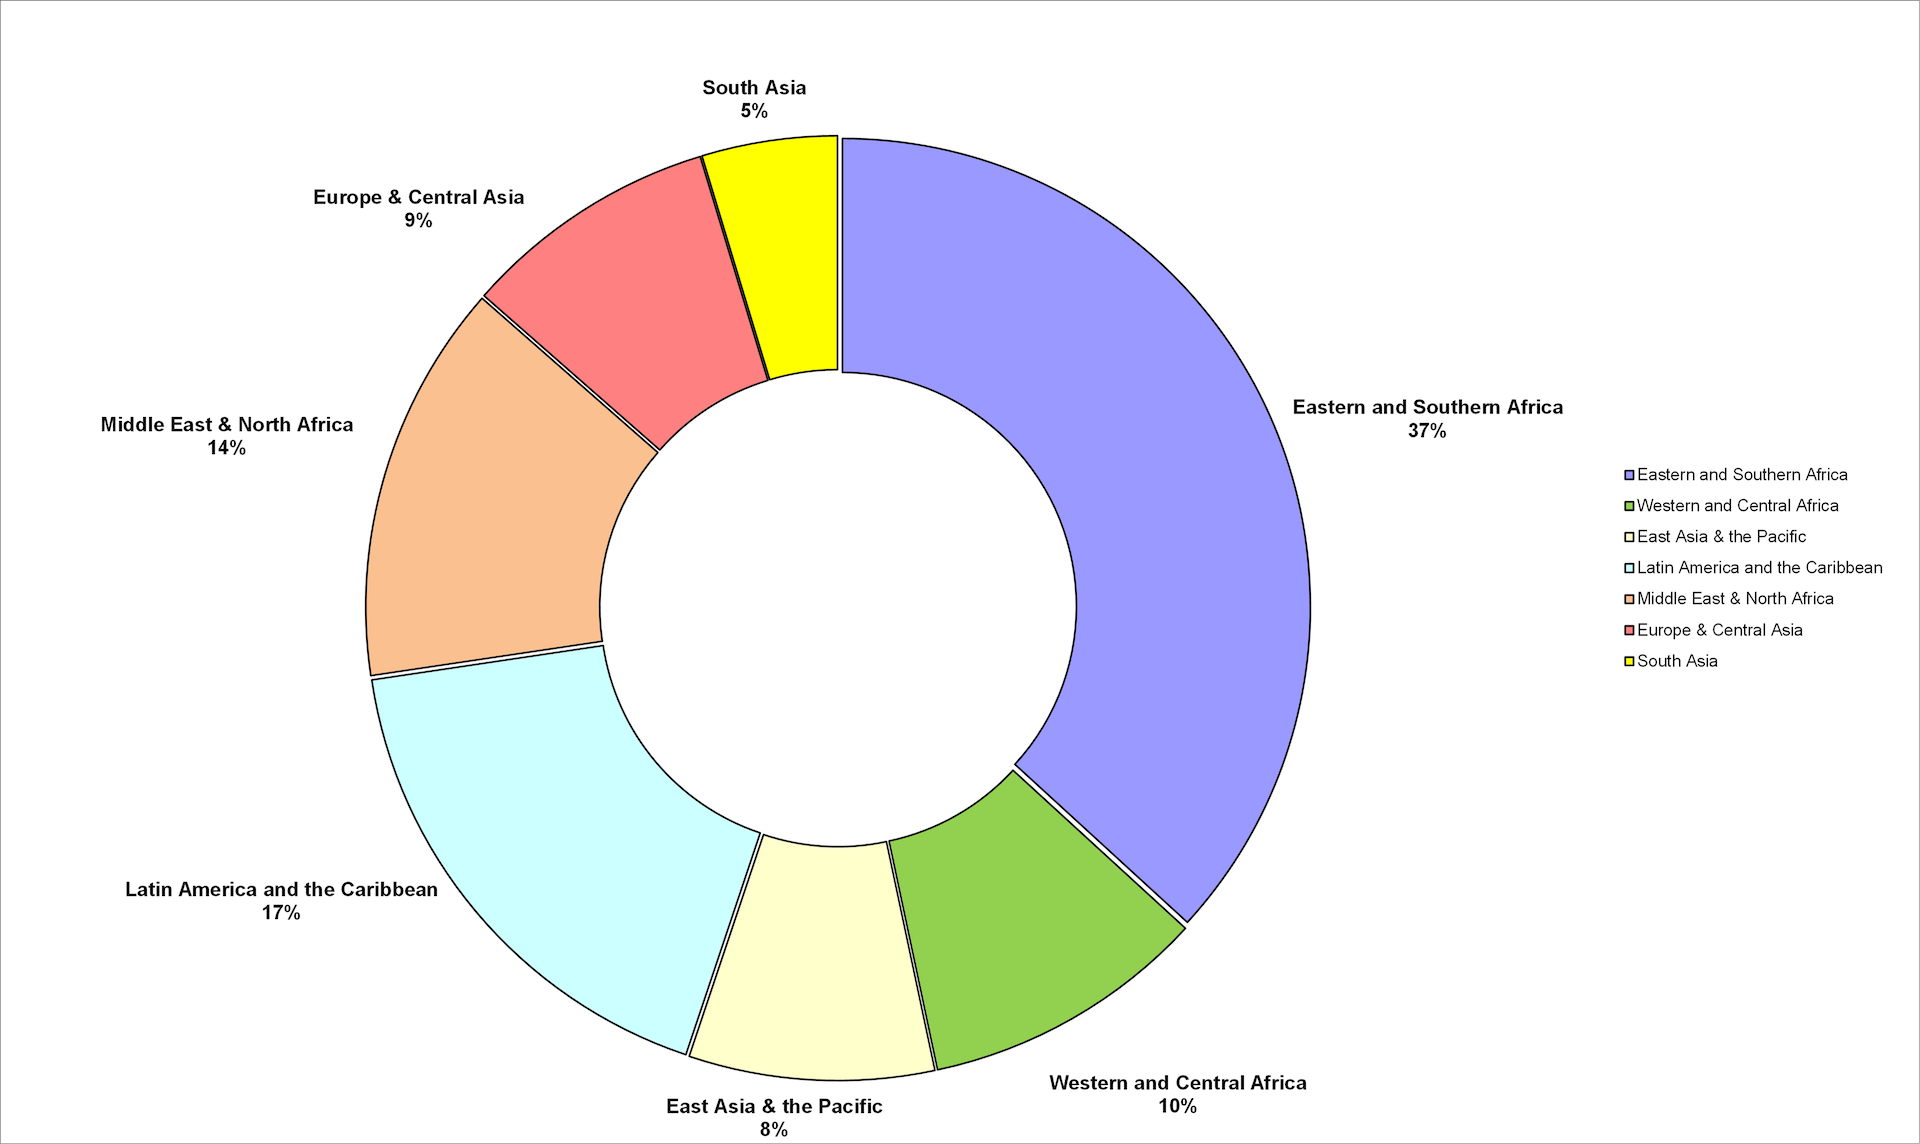
3.6 Transport Lending Breakdown by Region, 2021 (total $ 4,66 billion)
Source: World Bank
* IBDR +IDA commitments
No data for Middle East & North Africa


