2.1 Length of total road network by category(*) by country, end of 2023* (km)
| Motorways | Main or national roads | Secondary or regional roads | Other roads** | Total | |
| BE | 1 763 | 13 229 | 1 349 | 138 869 | 155 210 |
| BG | 840 | 2 879 | 4 019 | 12 230 | 19 968 |
| CZ | 1 388 | 5 747 | 48 729 | 74 919 | 130 783 |
| DK | 1 355 | 2 606 | 70 985 | 74 946 | |
| DE | 13 210 | 37 746 | 86 704 | 91900 | 229 560 |
| EE | 225 | 3 746 | 13 011 | 48 822 | 65 804 |
| IE | 995 | 5 434 | 13 448 | 83 533 | 103 410 |
| EL | 2 296 | 14 210 | 33 013 | 75 600 | 125 119 |
| ES | 15 886 | 14 728 | 67 994 | 501 053 | 599 661 |
| FR | 11 751 | 9 474 | 379 091 | 711 378 | 1 111 695 |
| HR | 1 341 | 7 256 | 9 396 | 8 502 | 26 495 |
| IT | 7 558 | 30 045 | 132 234 | 68 901 | 238 738 |
| CY | 271 | 5 470 | 2 474 | 5 083 | 13 298 |
| LV | – | 19 879 | 29 467 | 8 559 | 57 905 |
| LT | 462 | 6 676 | 14 527 | 51 678 | 73 343 |
| LU | 167 | 851 | 1 894 | 19 | 2 931 |
| HU | 1 871 | 30 756 | 188 127 | 189 998 | |
| MT | – | 2 841 | 2 841 | ||
| NL | 2 793 | 2 793 | 8 004 | 128 455 | 142 045 |
| AT | 1 749 | 10 260 | 23 553 | 92 204 | 127 766 |
| PL | 1 851 | 19 473 | 153 808 | 255 081 | 430 213 |
| PT | 3 113 | 6 435 | 4 791 | 4 791 | 19 130 |
| RO | 997 | 16 680 | 35 046 | 33 665 | 86 388 |
| SI | 616 | 5 929 | 32 423 | 38 968 | |
| SK | 865 | 3 335 | 3 615 | 38 139 | 45 954 |
| FI | 948 | 13 467 | 13 452 | 50 885 | 78 752 |
| SE | 2 194 | 13 528 | 139 925 | 43 606 | 199 253 |
| IS | 41 | 4 912 | 3 457 | 4 580 | 12 990 |
| NO | 637 | 10 539 | 44 776 | 40 047 | 95 999 |
| CH | 1 549 | 710 | 17 203 | 65 406 | 84 868 |
Source: Eurostat [road_if_roadsc], International Road Federation (www.irfnet.ch) (BE, EL, LU, MT, IS), national statistics
Notes:
*BE end of 2015; EL: 2018 (other roads); LU: 2018 (other roads); IT: 2022;
CY: other road network includes forest gravel roads
**: the definition of road types varies from country to country, the data are therefore not fully comparable. CY: other road network includes forest gravel roads.
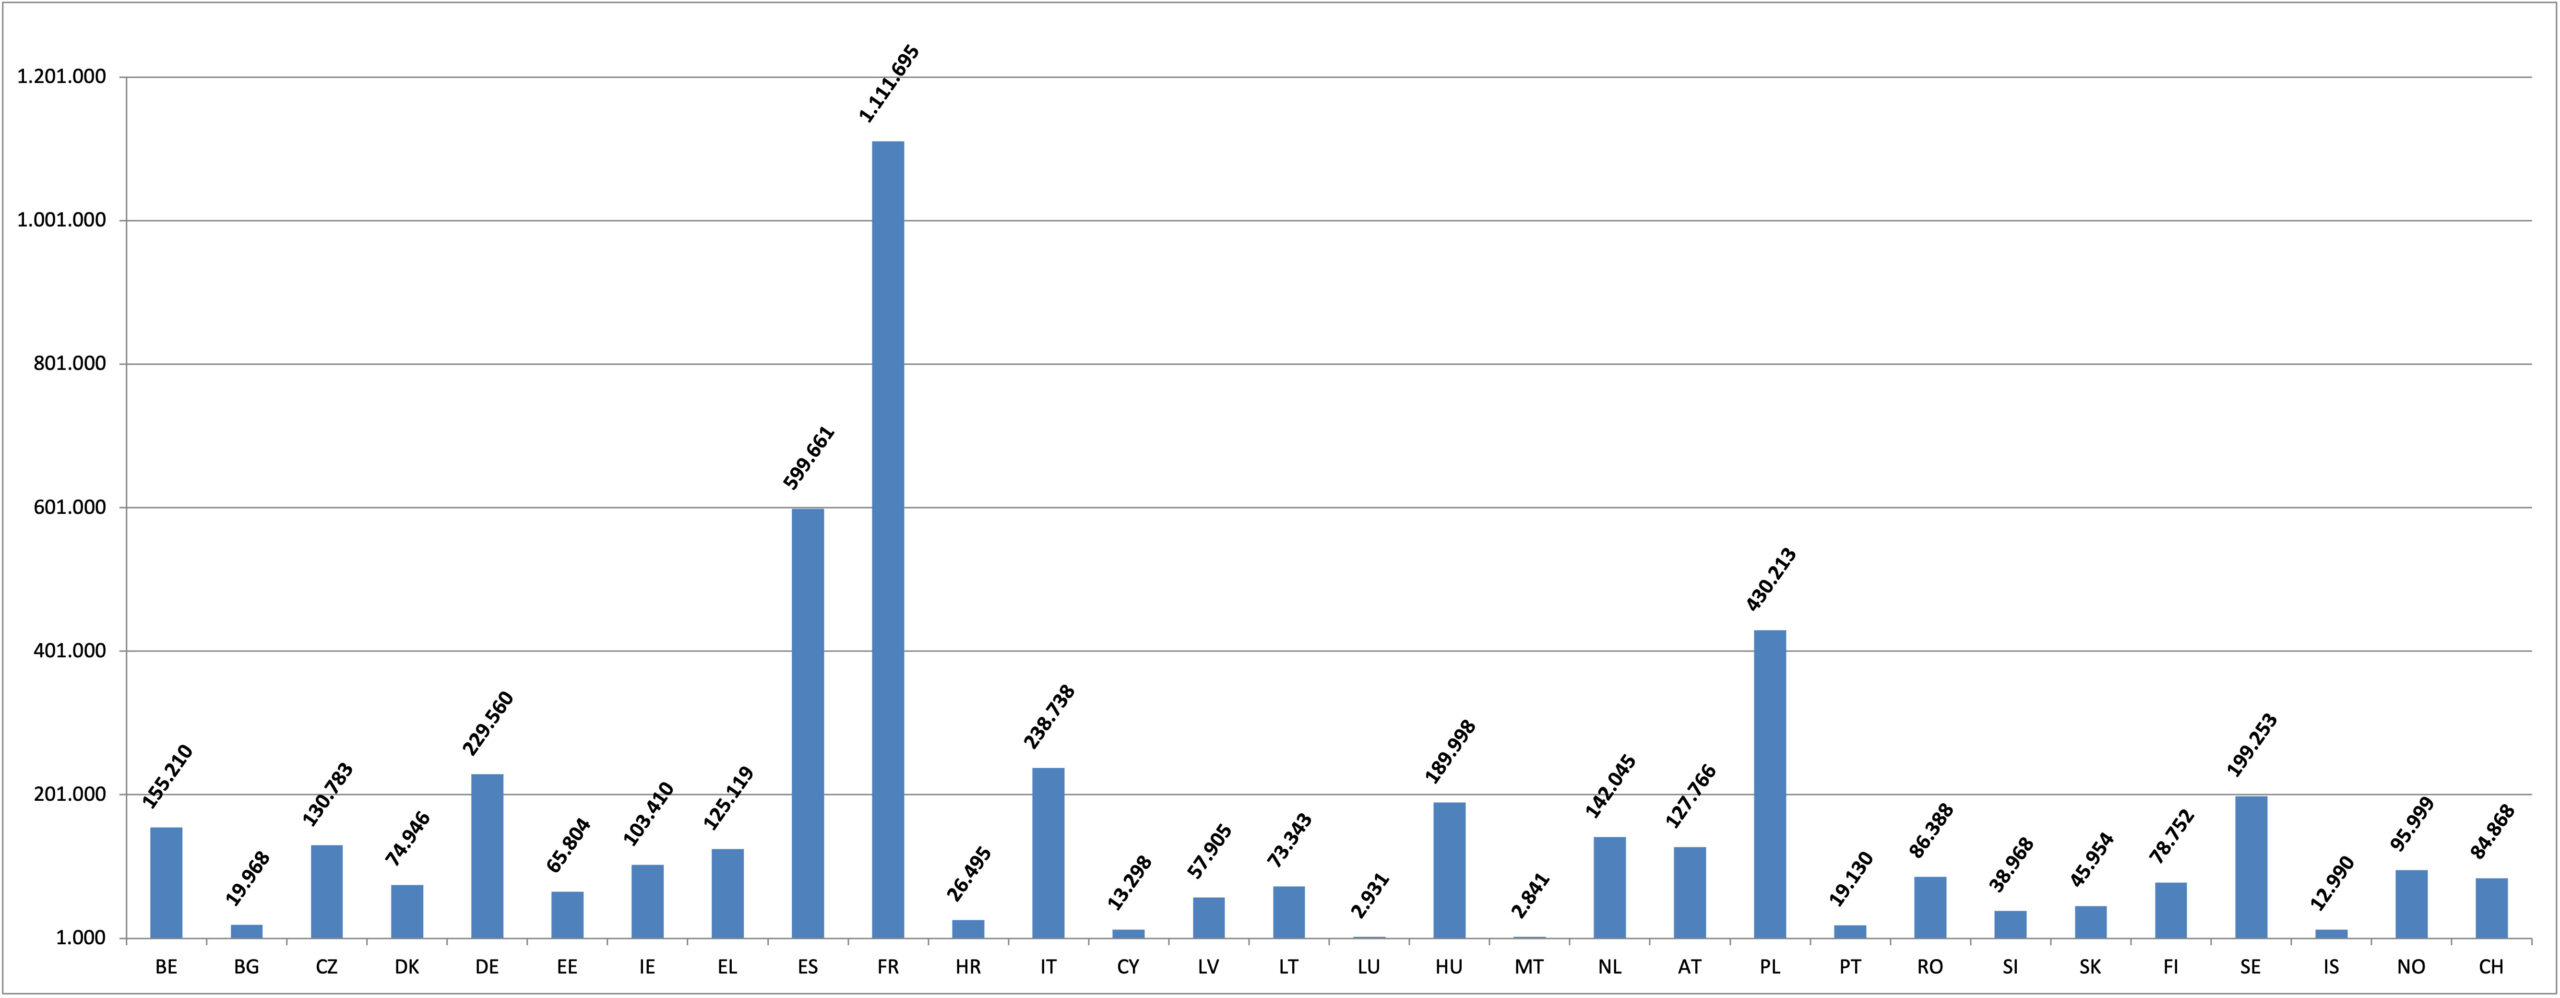
2.2 Length of total road network by country, 2023 (km)
Source: EC, IRF
2.3 Density of the total road network in EU countries, 2023 (km road/ km² land area)
Source: EC
Notes:
BE end of 2015
EL end of 2018
LU: 2018
IT: 2020 data
2.4 Length of motorway network in selected countries, 2023 (km)
Notes:
BE end of 2015
EL end of 2018
LU: 2018
IT: 2020 data
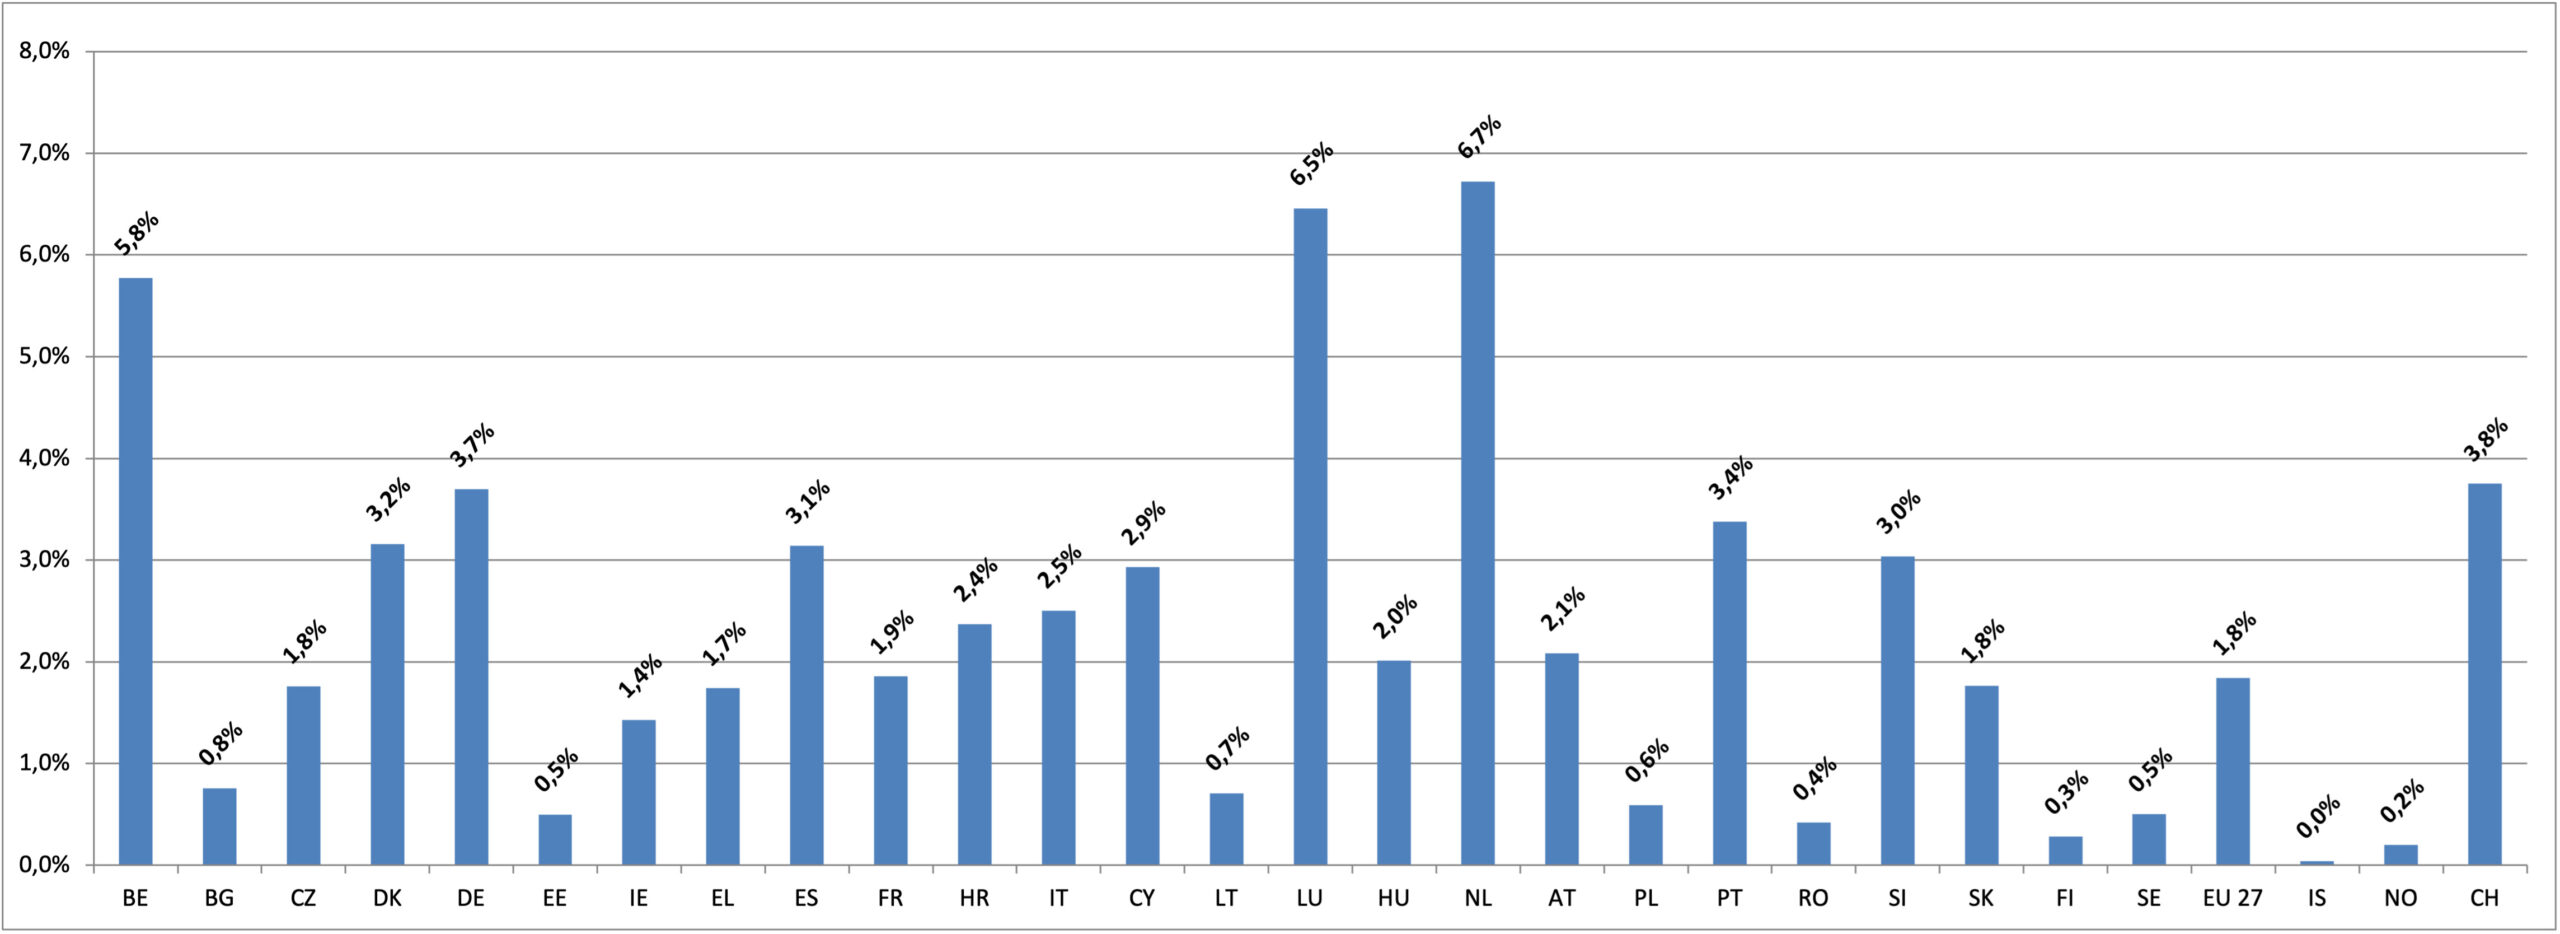
2.5 Proportion of motorways compared to the total road network in EU countries, 2023 (%)
Source: EC
Notes:
BE end of 2015
EL end of 2018
LU: 2018
IT: 2020 data
2.6 Density of motorways in EU countries, 2023 (km motorway per 100 km² land area)
Source: Eurostat, EC
BE end of 2015
EL end of 2018
LU: 2018
IT: 2020 data
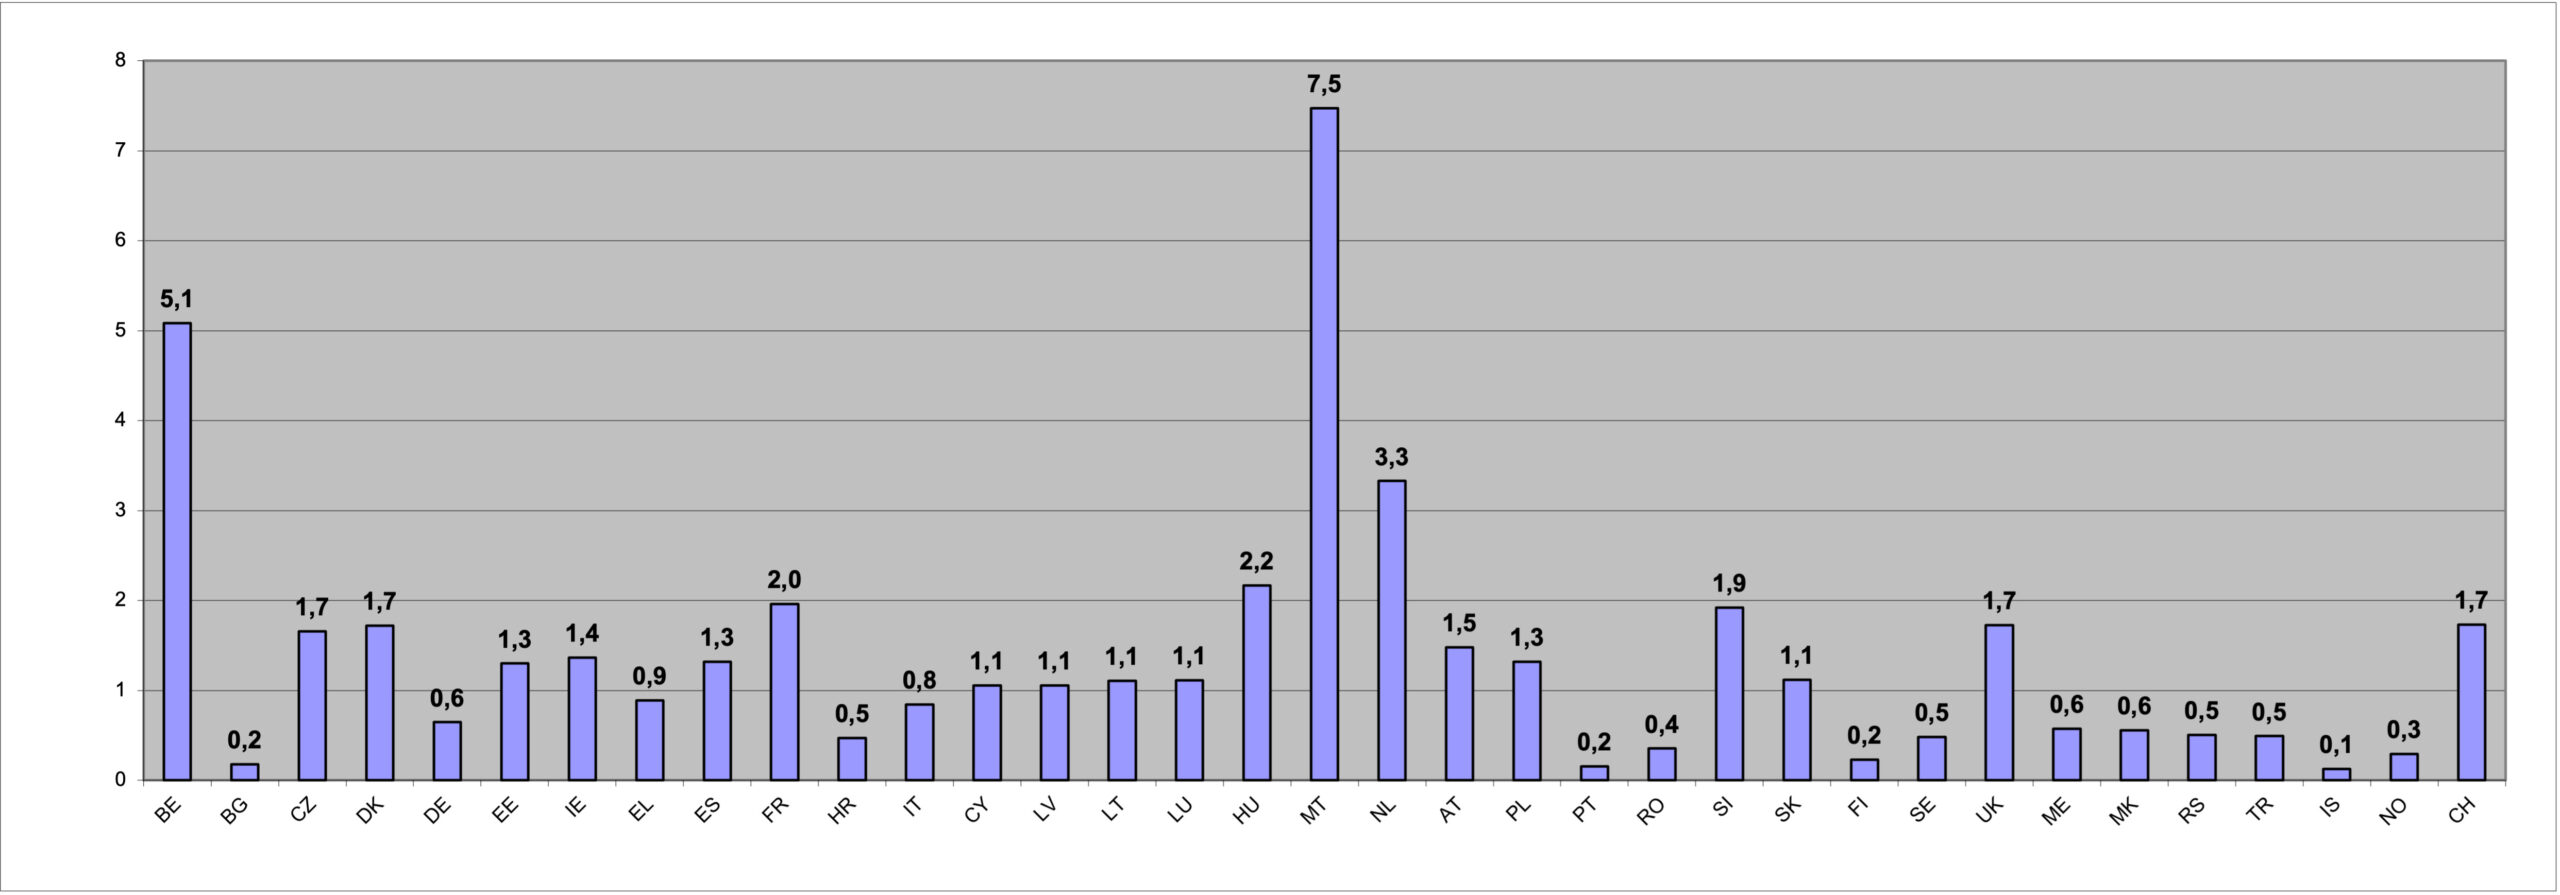
2.7 Passenger cars per km of motorway in selected countries, 2023
Source: Eurostat
2.8 Transport network Comparison between EU 27, USA, Japan, Russia and China, 2023 (thousand km)
| EU 27 | USA (1) | Japan (2) | China | Russia(3) | |
| Road network (paved) |
4,340.0 | 6,758 | 1,066 | 5,270 | 1,234 |
| Motorway network | 77.0 | 108.5 | 9.3 | 183.6 | 65.0 |
| Railway network | 201.0 | 147.8 | 18.9 | 158.7 | 87.0 |
| Electrified rail lines | 115.0 | – | 11.2 | 119.4 | 45.0 |
Notes:
(1) public roads
(2): Japan: national expressways.
(3): RU: roads of federal importance
2.9 Density of motorways Comparison between EU 27, USA, Japan, Russia and China, 2023 (km motorway per km² land area)
Source: EC
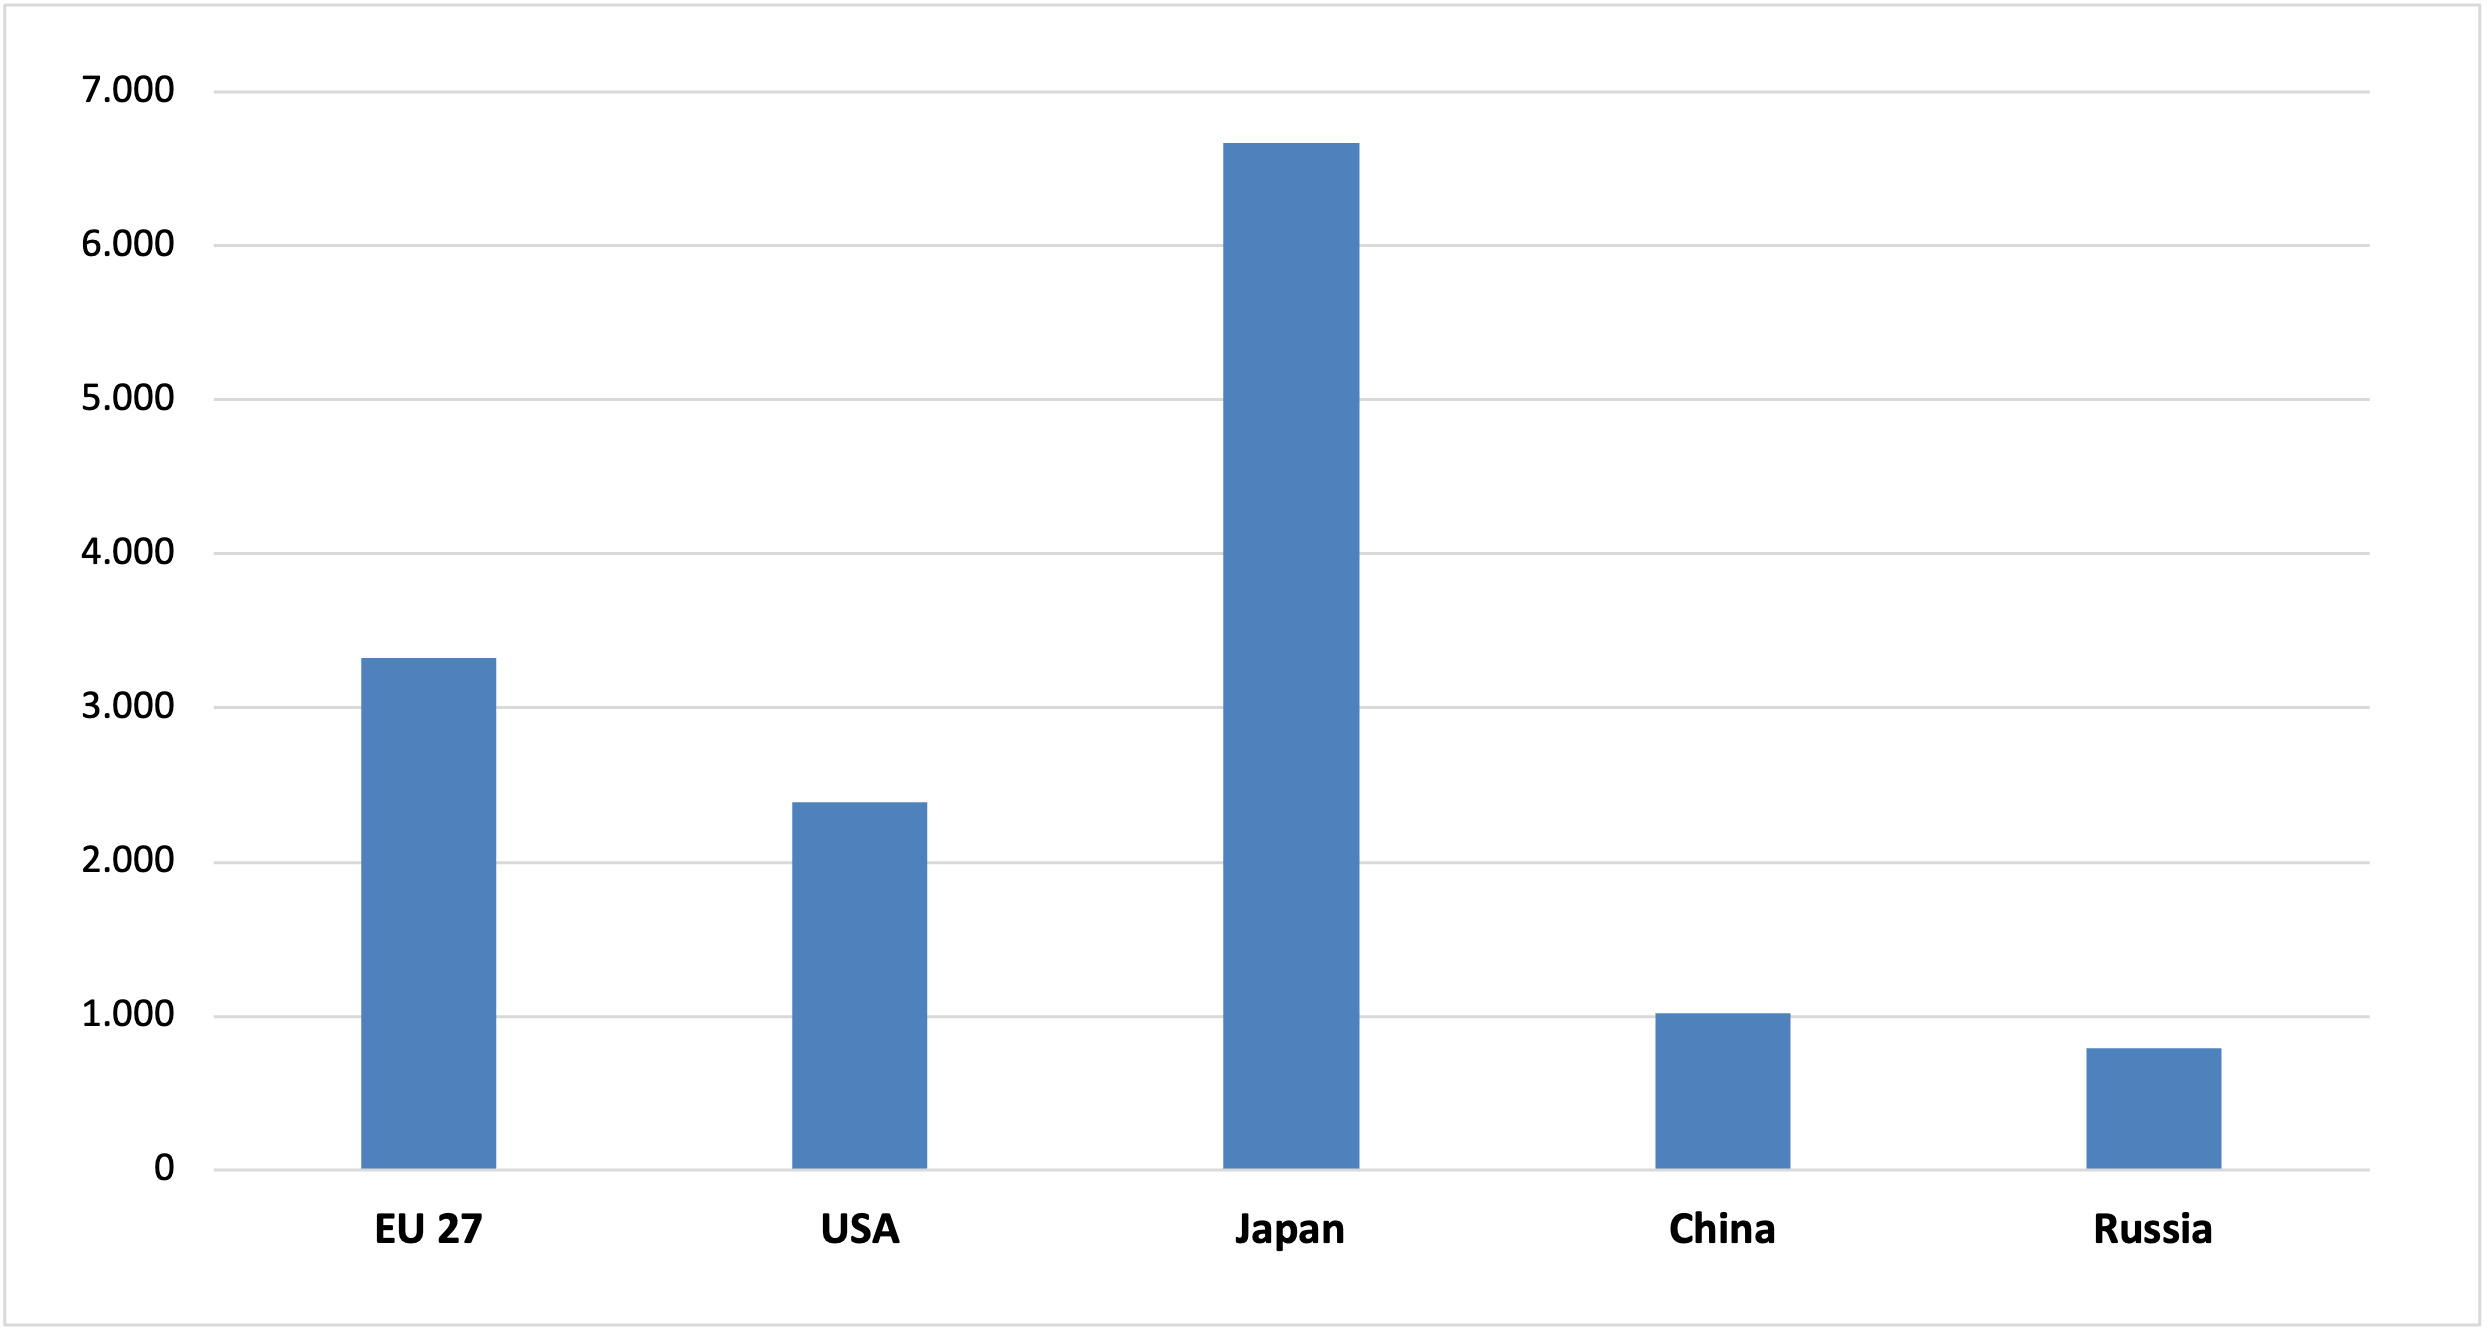
2.10 Passenger cars per km of motorway. Comparison between EU 27, USA, Japan, Russia and China, 2023
Source: Eurostat, International Road Federation, International Transport Forum, Union Internationale des Chemins de Fer, national statistics
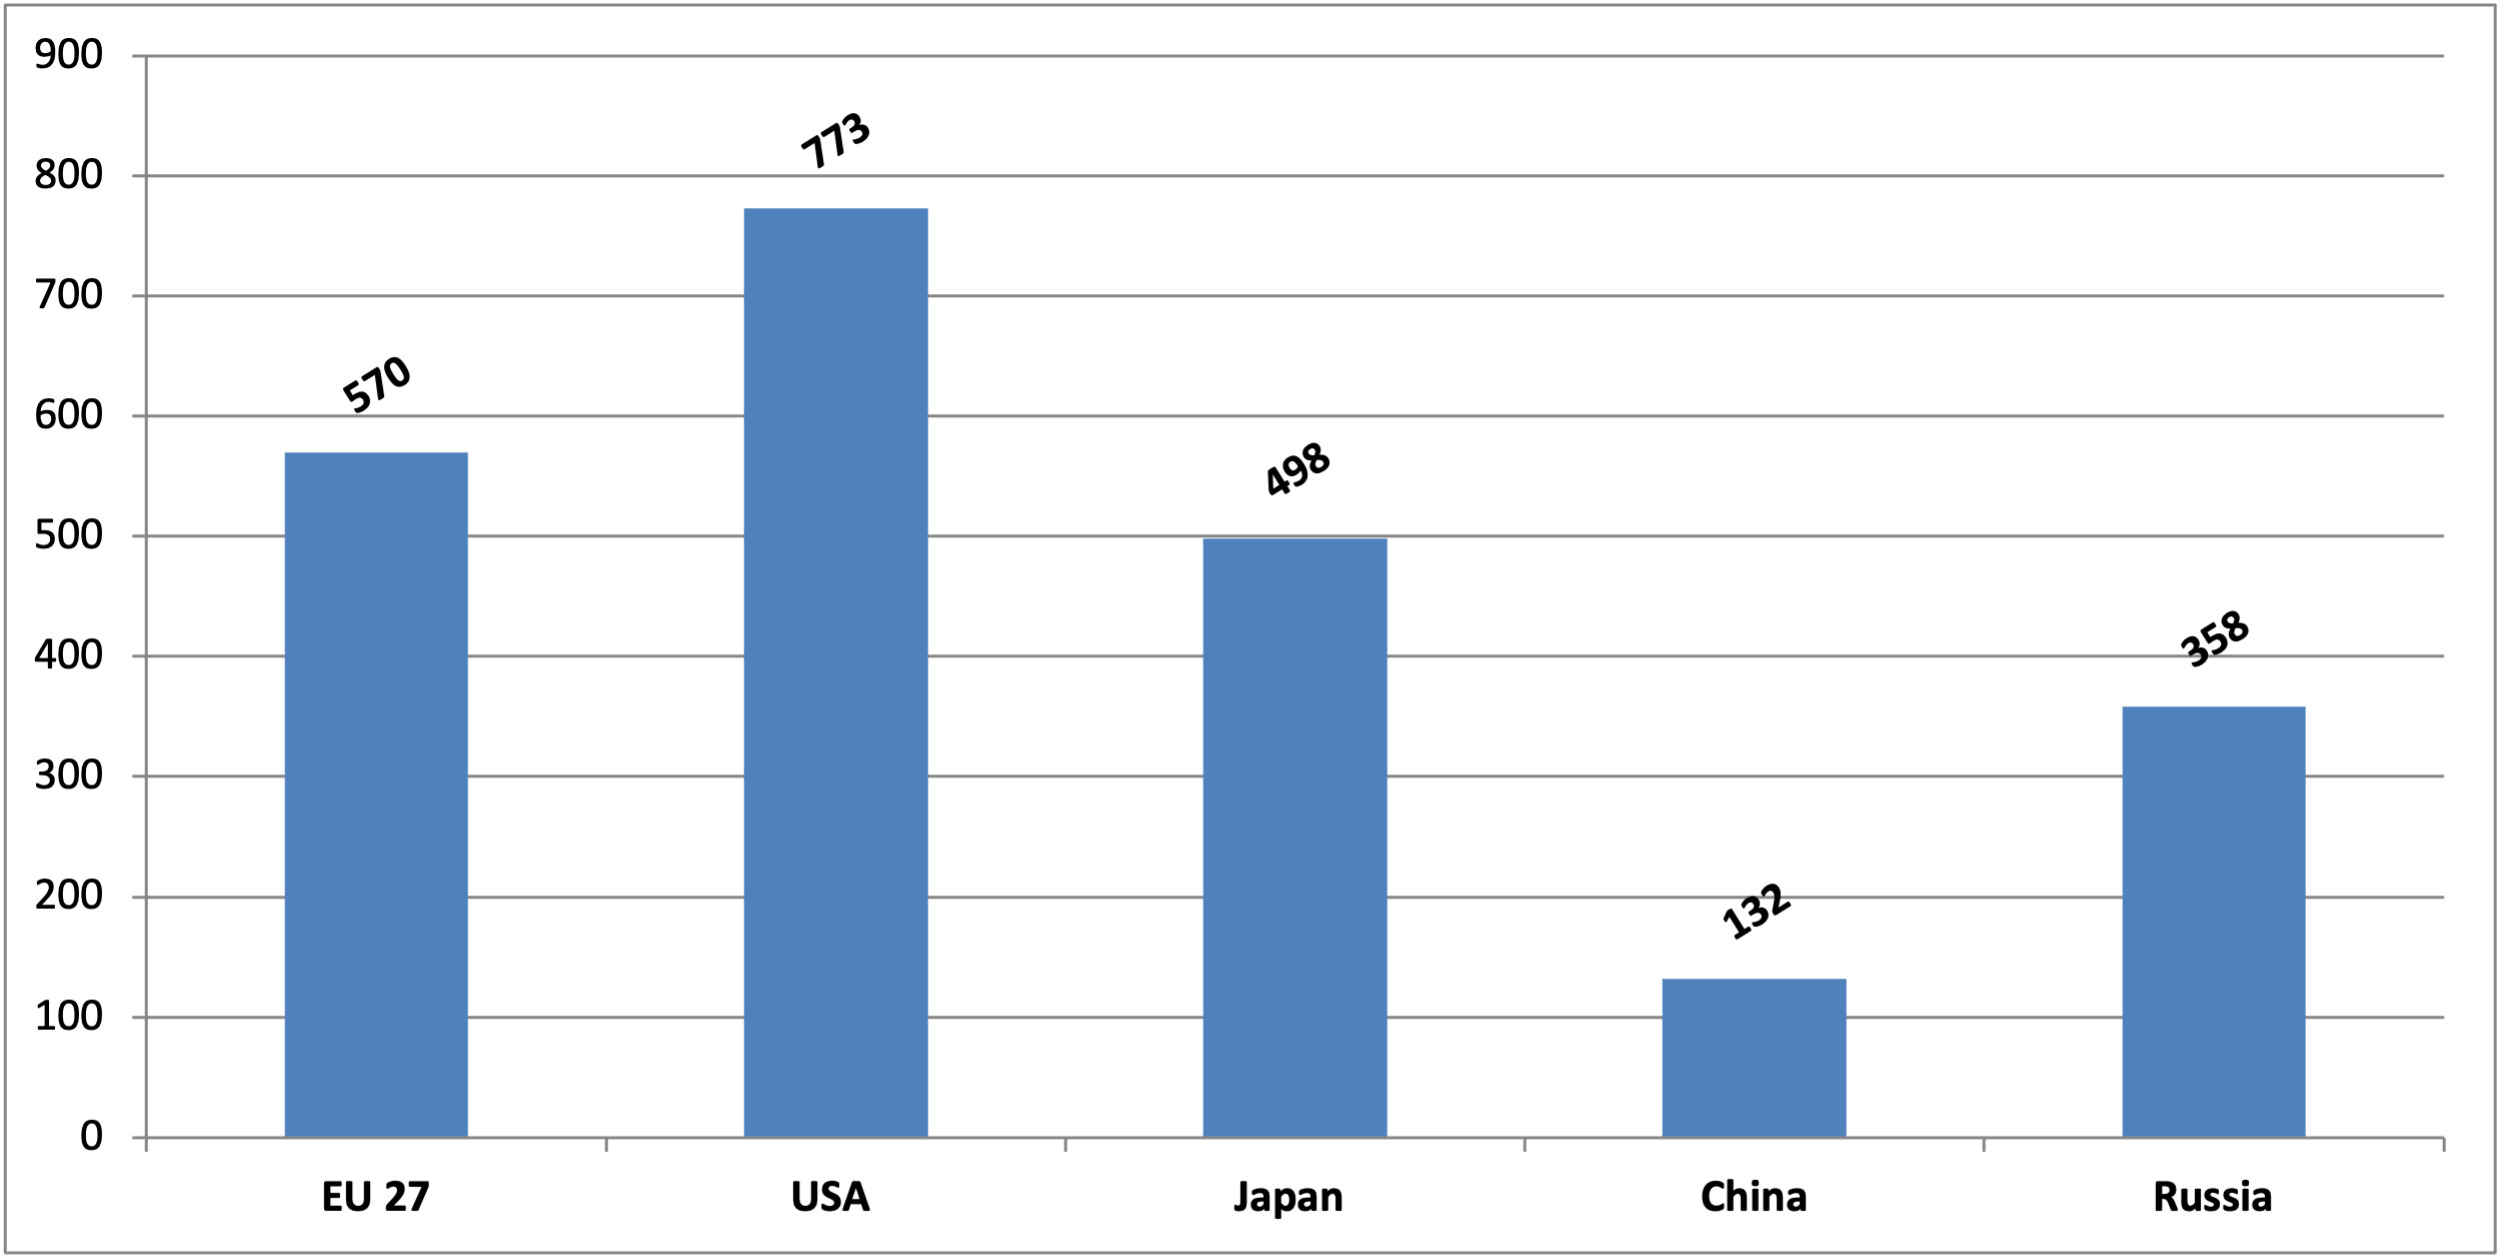
2.11 Cars/1000 person in EU 27, USA, Japan, Russia and China, 2023
Source: EC

