4.1 Gross investment spending in road infrastructure in selected countries, 2017 - 2023 (at current prices and exchange rates - million Euros)
| Country/Year | 2017 | 2018 | 2019 | 2020 | 2021 | 2022 | 2023 |
| AT | 515 | 463 | 562.0 | 548 | 480 | 460 | |
| BE | 656 | 681 | 735.0 | 607 | 1311 | 1001 | 1031 |
| BG | 115 | 883 | 528.2 | 525.1 | 152 | 403 | 614 |
| HR | 197 | 286 | 354.8 | 442.0 | 537 | 471 | 620 |
| CZ | 984 | 1045 | 1383 | 1641 | 1817 | 1943 | 2626 |
| DK | 1066 | 1084 | — | — | — | — | — |
| EE | 197 | 219 | 220.0 | 244 | 281 | 251 | — |
| FI | 1235 | 1526 | 1522.0 | 1444 | 1375 | 1677 | 1939 |
| FR | 9080 | 9884 | 10413 | 9631 | 10153 | 10613 | 10265 |
| DE | 13520 | 15810 | 16750 | 17090 | 16450 | 16565 | 18310 |
| EL | 3895 | 2158 | 741 | 781 | 731 | 900 | 1128 |
| HU | 1280 | 1780 | 2289 | 1820 | 1894 | 1555 | 1348 |
| IE | 547 | 693 | 837 | — | — | — | — |
| IT | 3409 | 6555 | 4310 | 4393 | 6185 | 6384 | — |
| LV | 226 | 221 | 223 | 198 | 201 | 196 | 227 |
| LT | 345 | 325 | 352 | 466 | 434 | 343 | 565 |
| LU | 226 | 189 | 260 | 246 | — | — | — |
| PL | 3210 | 2669 | 2415 | 3208 | 3170 | 3041 | 3713 |
| RO | 2134 | 2182 | — | — | — | — | — |
| SK | 750 | 769 | — | 752.2 | 1113 | 1148 | 860 |
| SI | 217 | 330 | 306 | 235 | 299 | 422 | 476 |
| ES | 3690 | 3518 | 3445 | 3927 | 3959 | 5289 | 4997 |
| SE | 2374 | 2497 | 2503 | 2942 | 2911 | 2896 | 2773 |
Source: ITF, OECD
Note: the data coverage varies significantly from a country to another, mainly due to the lack of more detailed common definitions and the difficulty for countries to change their data collection system.
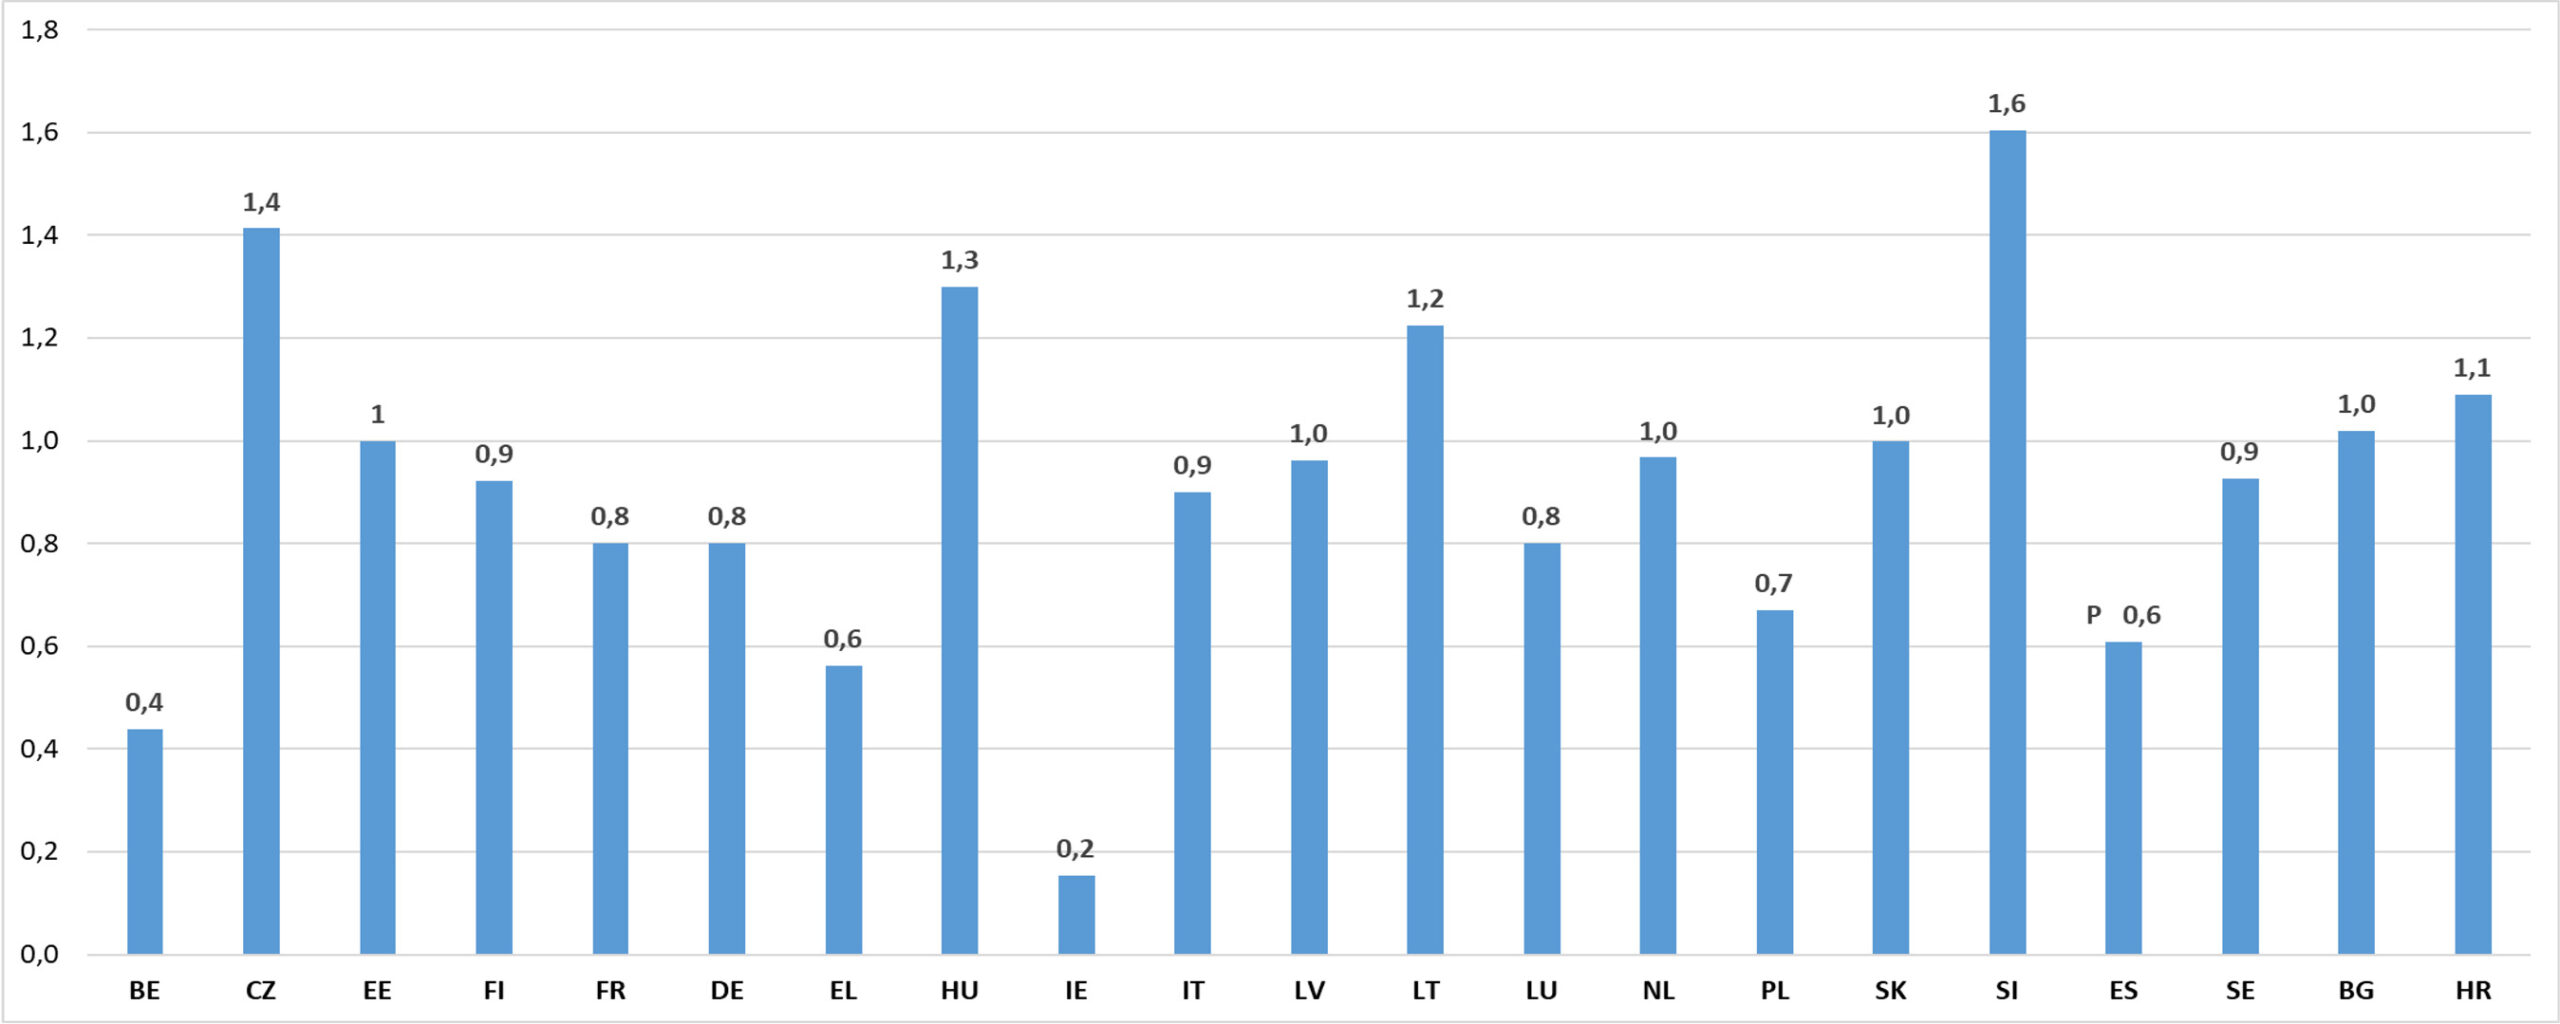
4.2 Investment in inland transport infrastructure in selected EU countries, 2023 (as a percentage of GDP, at current prices)
Source: ITF at the OECD
Data extracted on 22/09/2025
No data for: NL, PT, CY, MT, AT
EE, IT, LU: 2022 data
4.3 Volume of investment in inland transport infrastructure in selected areas, 2000 - 2021 (Euro) billion euros
Source: ITF
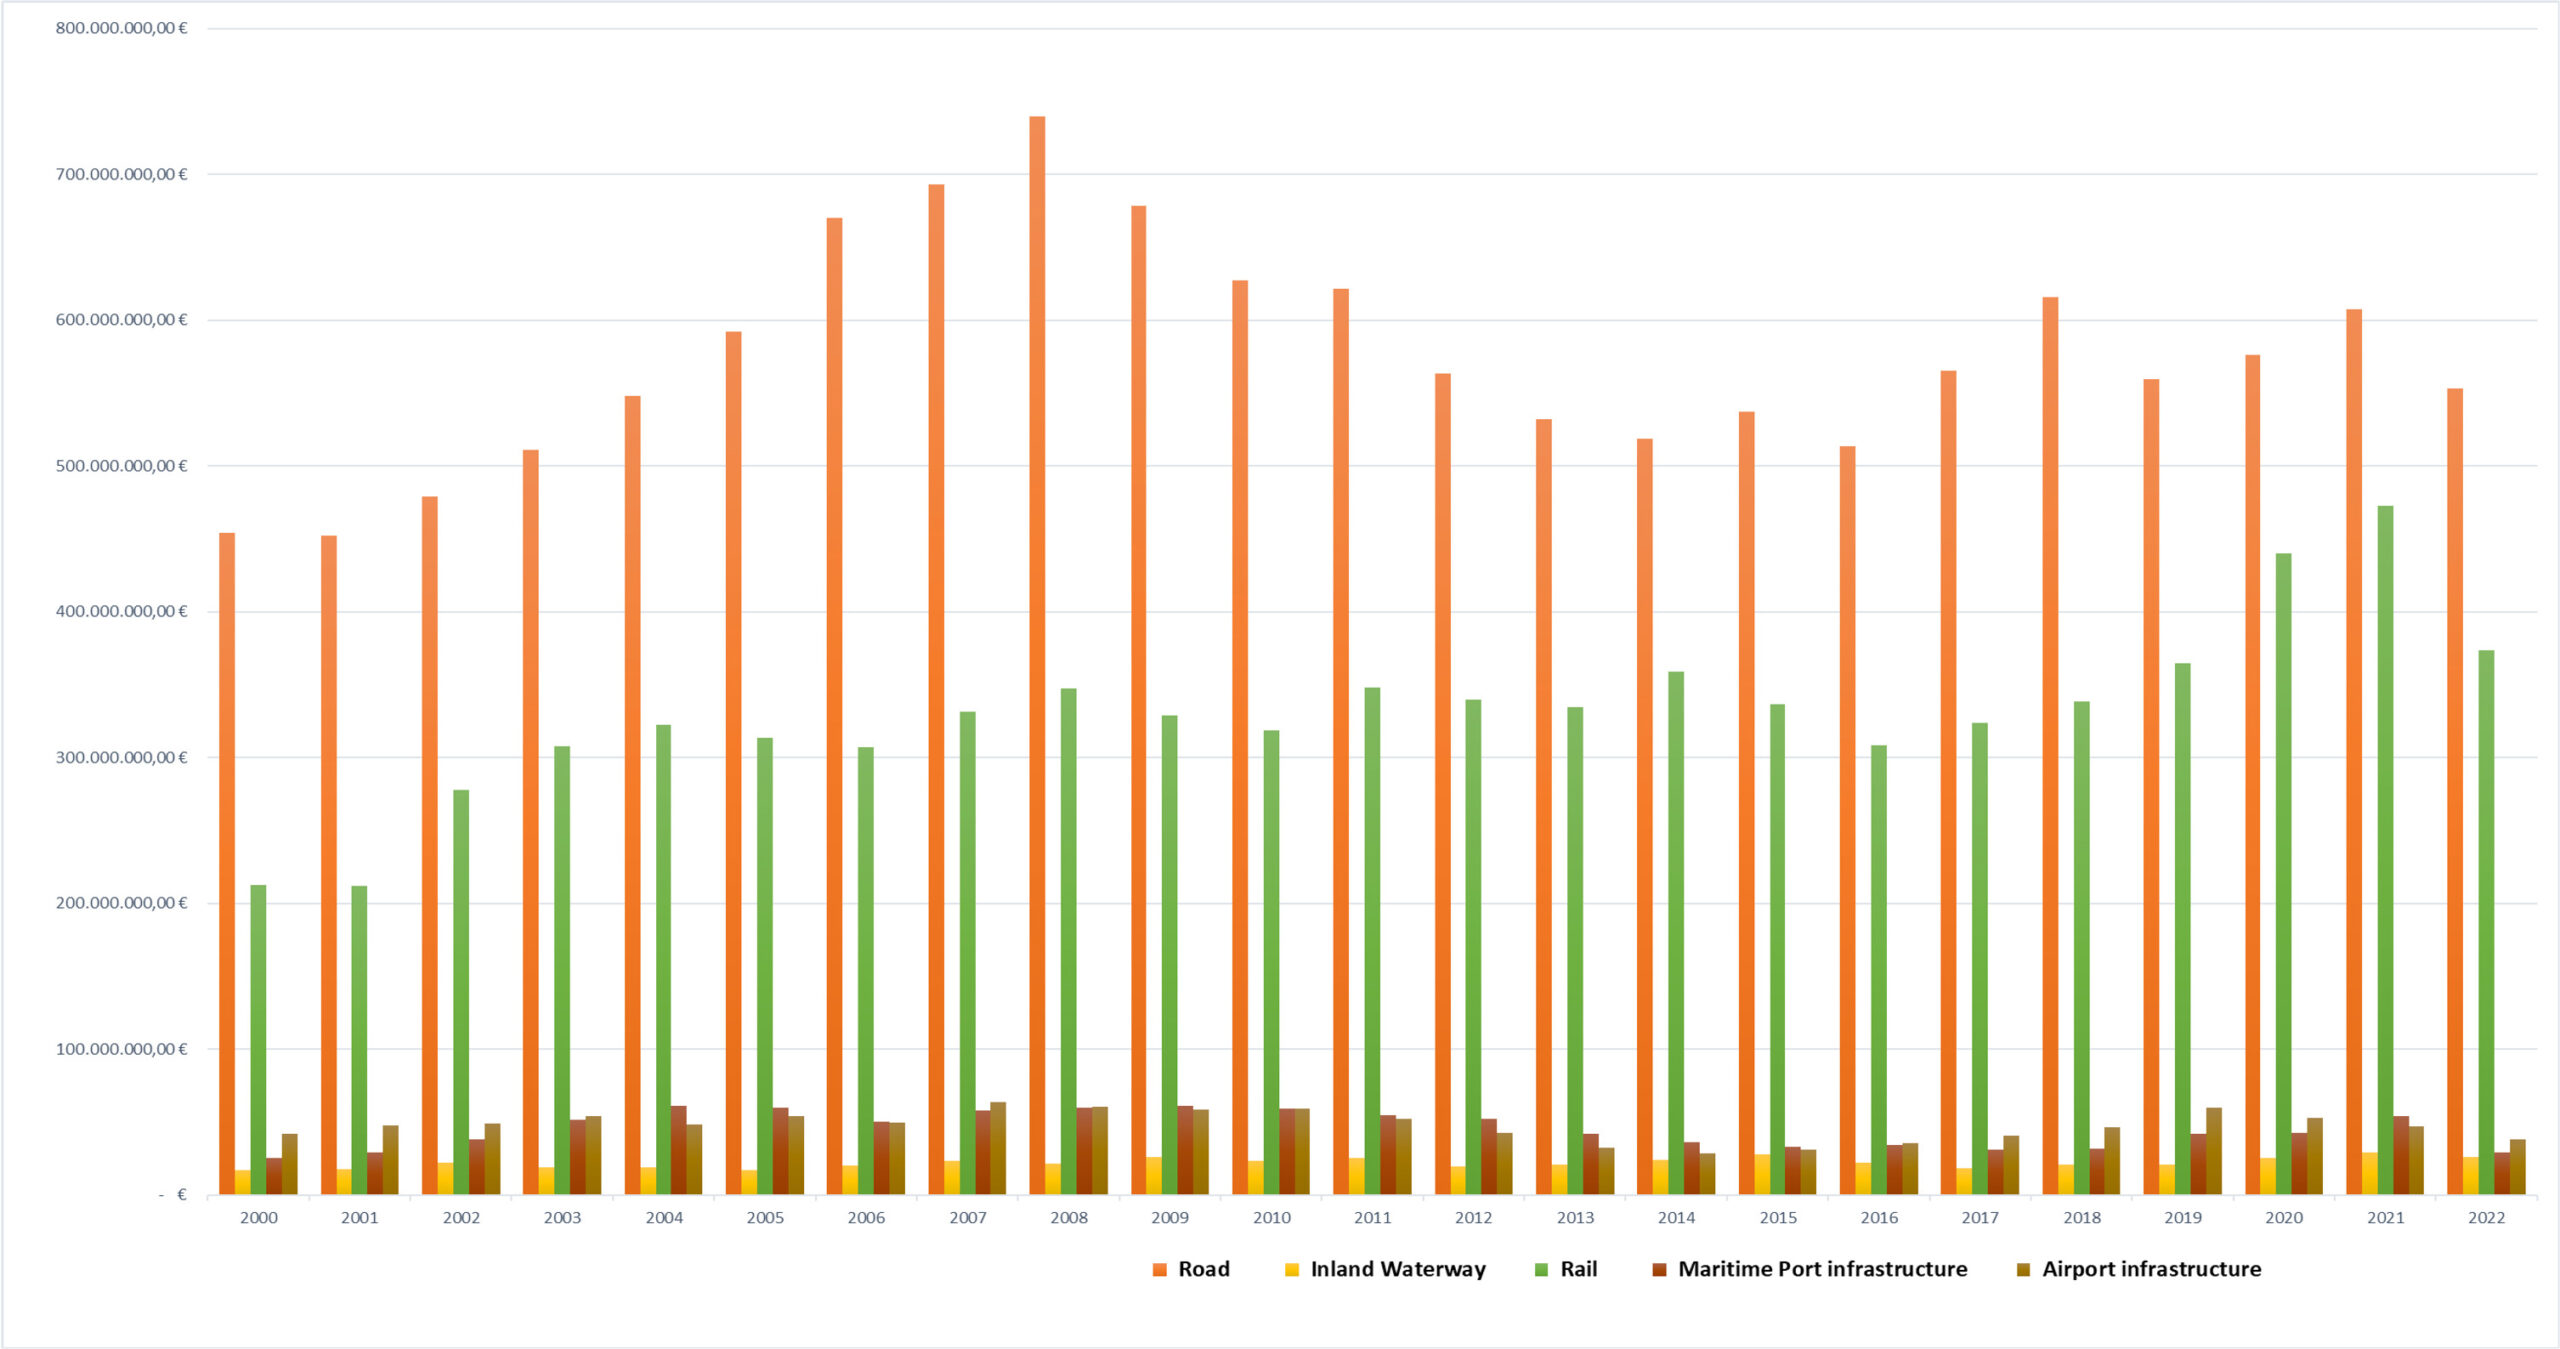
4.4 Distribution of infrastructure investment between modes in EU countries, 2000-2022 (Euros, current prices, current exchange rates)
Source: ITF
Note: For Road and Rail no data for CY+A142:A144
For IWI no data for CY, IE
4.5 Maintenance expenditures in road infrastructure in selected countries, 2017-2023 (at current prices and exchange rates - million Euros)
| GEO/TIME | 2017 | 2018 | 2019 | 2020 | 2021 | 2022 | 2023 |
|
BE |
397 | 216 | 213 | 155 | 498 | 287 | 313 |
|
CZ |
721 | 871 | 982 | 884 | 1,138 | 961 | 1240 |
|
DK |
1,118 | 1,151 |
— |
— |
— |
— |
— |
|
EE |
42 | 39 | 43 | 43 | 45 | 41 |
— |
|
FI |
304 | 316 | 321 | 349 | 351 | 378 | 391 |
|
FR |
2,604 | 2,794 | 2,838 | 2,703 | 2,927 | 3,034 | 3006 |
|
HU |
369 | 380 | 376 | 387 | 337 | 432 | 356 |
|
IE |
81 | 88 | 75 | 46 | 46 | 46 | 42 |
|
IT |
8,803 | 7,352 | 6,813 | 7,130 | 9,328 | 8,304 |
— |
|
LV |
179 | 202 | 180 | 259 | 288 | 263 | 238 |
|
LT |
151 | 144 | 147 | 140 | 146 | 200 | 168 |
|
LU |
54 | 67 | 40 | 39 |
— |
— |
— |
|
NL |
2,039 | 2,182 | 2,149 | 2,374 | 2,414 | 2,907 | 2796 |
|
PL |
517 | 465 | 481 | 504 | 557 | 548 | 592 |
|
SK |
230 | 296 |
— |
232 | 360 | 348 | 376 |
|
SI |
117 | 115 | 122 | 139 | 134 | 137 | 184 |
|
SE |
1,035 | 1,033 | 1,000 | 1,028 | 1,230 | 1,209 | 1247 |
|
BG |
164 | 257 | 213 | 379 | 152 | 344 | 416 |
|
HR |
171 | 190 | 253 | 239 | 244 | 260 | 328 |
|
Total |
19,096 | 18,158 | 16,246 | 17,029 | 20,195 | 19,699 | 11,692 |
|
AL |
14 | 13 | 13 | 9 | 22 | 27 | 34.00 |
|
TR |
229 | 236 | 326 | 372 | 364 | 405 | 426 |
|
IS |
68 | 83 | 71 | 68 | 74 |
— |
— |
|
CH |
2,709 | 2,593 | 2,634 | 2,785 | 2,711 | 2,861 |
— |
Source: ITF
Notes: No data for NL, PT and RO
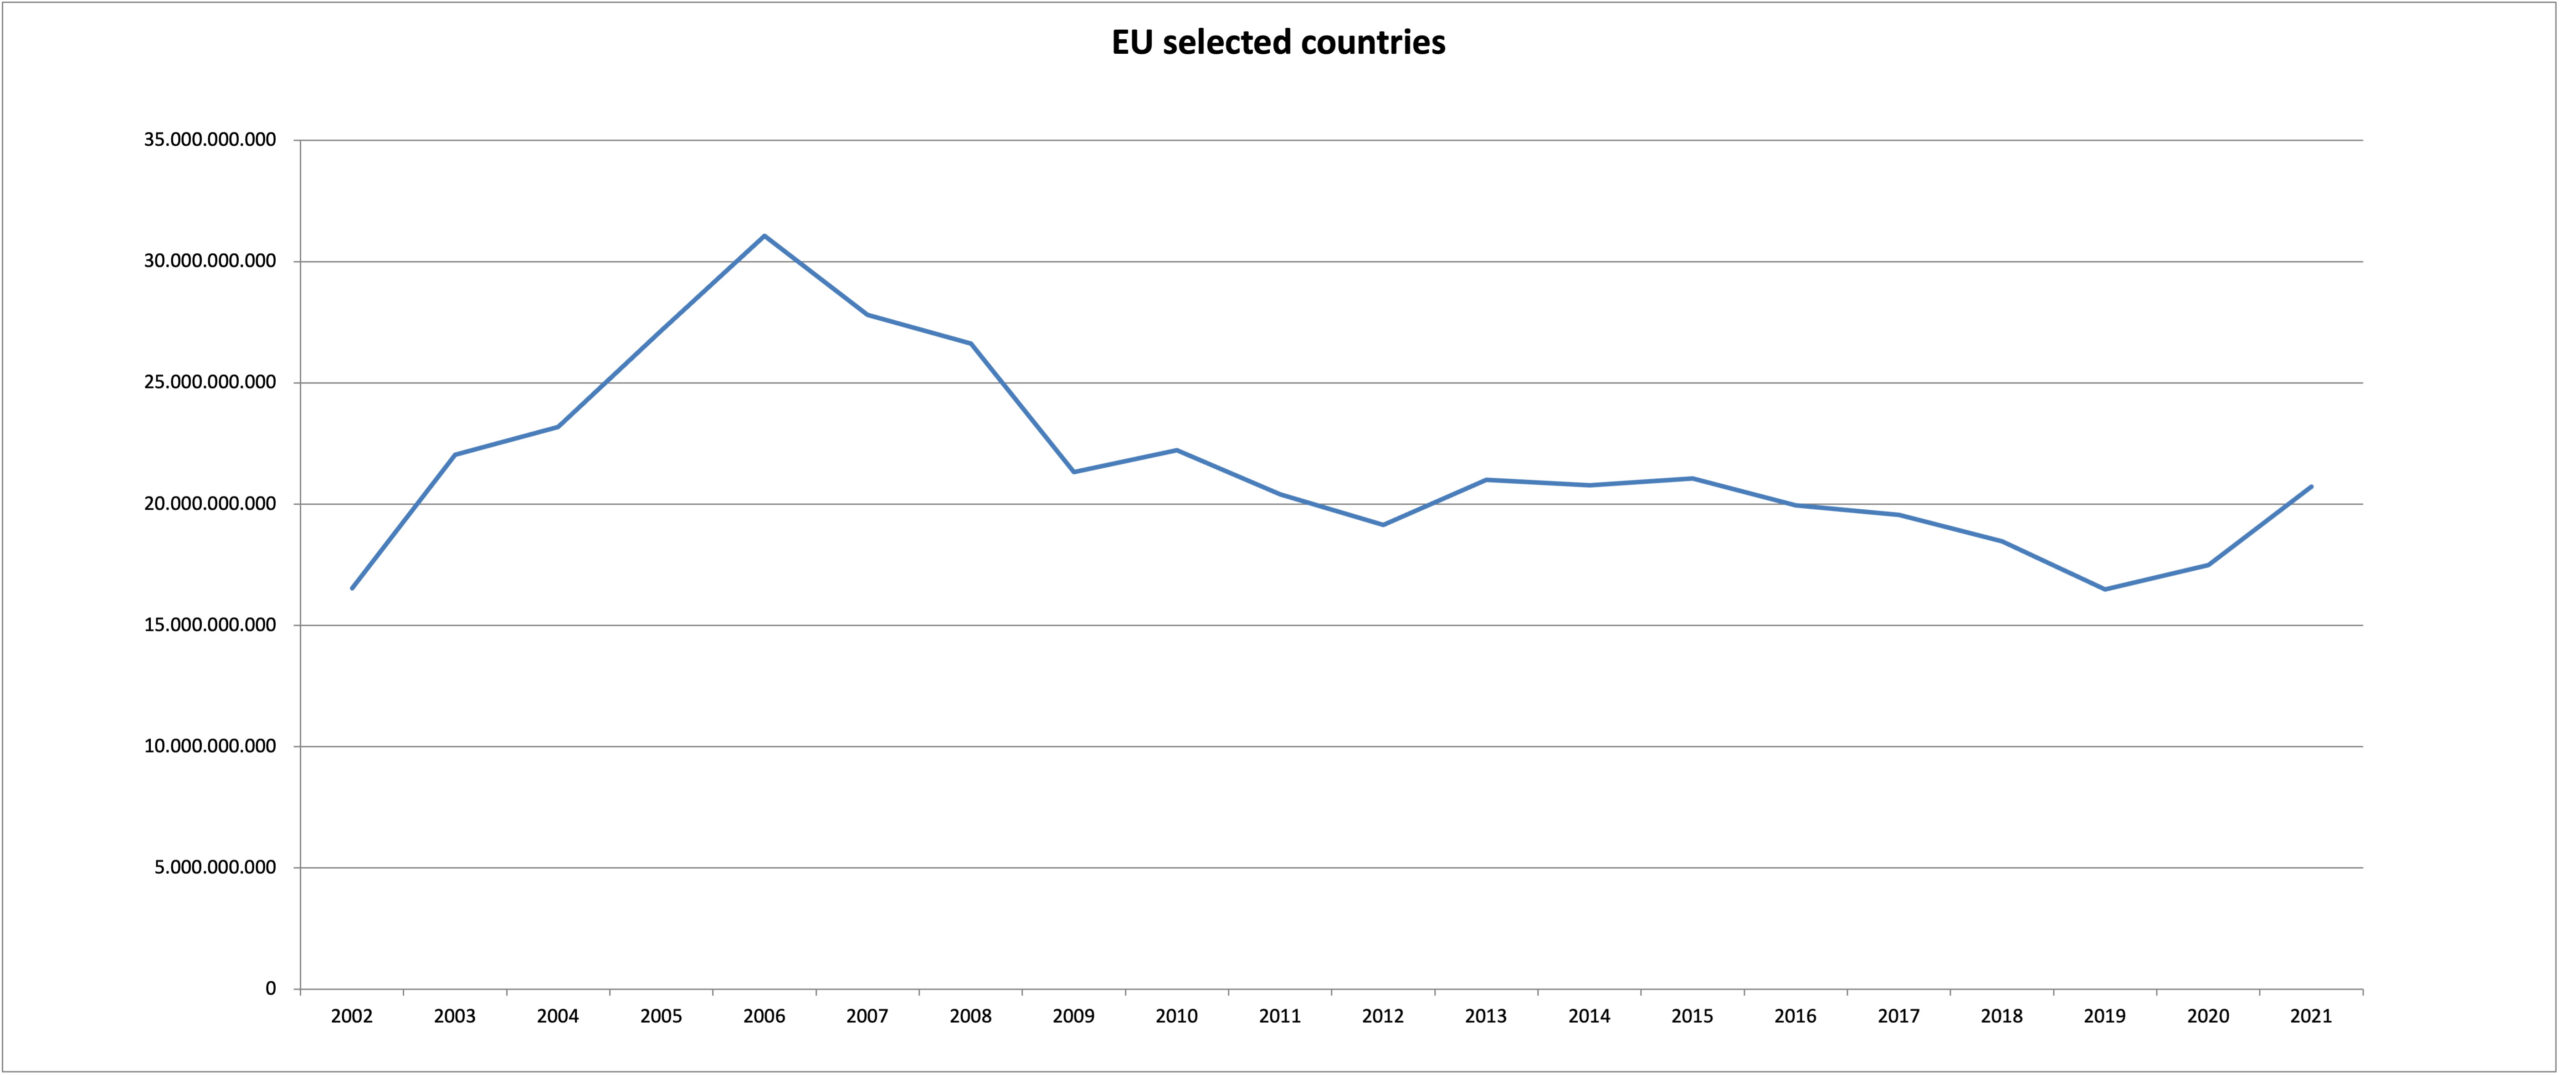
4.6 Maintenance expenditures in road infrastructure in EU selected countries, 2002 - 2021 (million Euros)
Source: ITF
no data for PT, RO,CY,EL and SI and as from 2019 no data for DK and LU


