8.1 Fiscal income from motor vehicles in EU selected countries, (EUR billion) *
| IE | IT | NL | PT | ES | SE | |
|---|---|---|---|---|---|---|
| € bn | € bn | € bn | € bn | € bn | SEK bn | |
| 2019 | 2022 | 2022 | 2021 | 2023 | 2021 | |
| VAT on vehicles, servicing/repair parts, tyres | 0.7 | 19.2 | 1.4 | 2.8 | 11.1 | 25.5 |
| Sales & registration taxes | 1.0 | 1.6 | 1.6 | 0.4 | 0.6 | — |
| Annual ownership taxes | 0.9 | 7.2 | 10.8 | 9.5 | 3.0 | 1.1 |
| Fuels & Lubricants | 3.5 | 32.8 | 9.6 | 2.8 | 22.8 | 57.0 |
| Driving license fees | 0.0 | — | 0.4 | — | 0.1 | 0.0 |
| Insurance taxes | 0.1 | 3.7 | 1.2 | — | 1.1 | 2.8 |
| Tolls | — | 2.2 | — | 0.2 | – | 2.8 |
| Customs duties | — | — | – | — | — | — |
| Other taxes | — | 4.3 | 0.6 | 1.5 | 0.8 | 1.3 |
| TOTAL (National currencies) | 6.2 | 71.0 | 19.2 | 8.5 | 39.5 | 104.9 |
| Total in EURO ** | 6.2 | 71.0 | 19.2 | 8.5 | 39.5 | 9.2 |
| Total = EUR 153.6 bn | ||||||
Source: ACEA
* lates available data; only countries for which sourced data is available are listed;
*** Euro foreign exchange reference rates at 26 March 2024; source: ECB
8.2 Revenues from environmentally related taxes in % of GDP
8.2.1 Environmental tax revenues by % of GDP in EU countries, 2023
| % of GDP in EU(27) Countries | |
| Country code | 2023 |
| AT | 2.03 |
| BE | 1.91 |
| CZ | 1.69 |
| DK | 2.33 |
| EE | 2.41 |
| FI | 2.26 |
| FR | 2.11 |
| DE | 1.62 |
| EL | 3.01 |
| HU | 1.82 |
| IE | 0.90 |
| IT | 2.53 |
| LV | 2.41 |
| LT | 1.63 |
| LU | 1.30 |
| NL | 2.40 |
| PL | 2.13 |
| PT | 2.26 |
| SK | 1.98 |
| SI | 2.98 |
| ES | 1.50 |
| SE | 1.56 |
| BG | 2.16 |
| HR | 3.16 |
| CY | 2.21 |
| MT | 1.86 |
| RO | 1.58 |
| EU * | 2.01 |
Source: OECD, data extracted on 26/9/2025
* OECD Europe
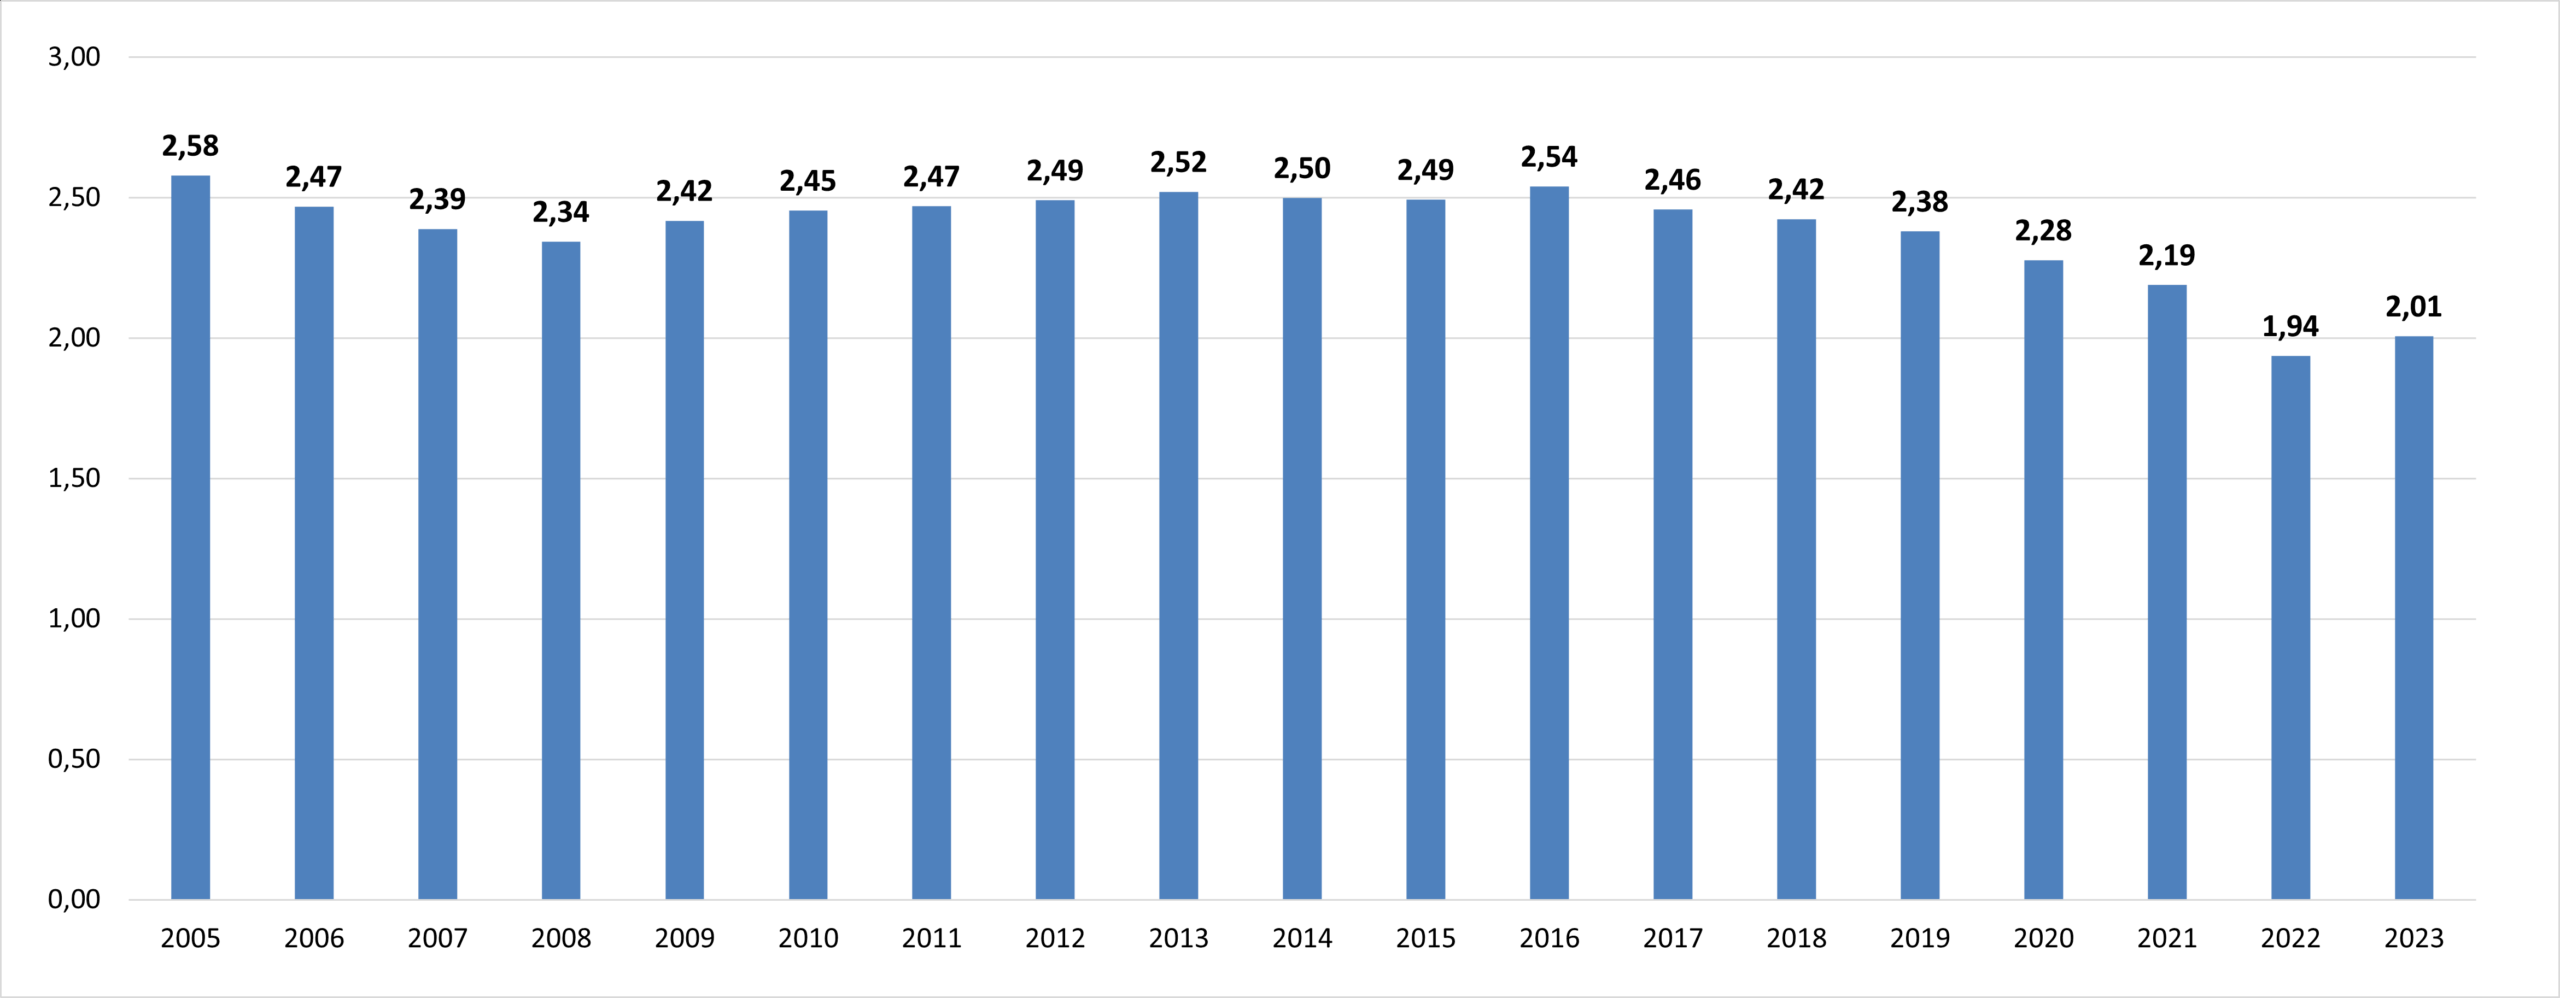
8.2.2 Evolution of environmental tax revenues by % of GDP in EU* countries, 2005-2023
Source: OECD
* OECD europe
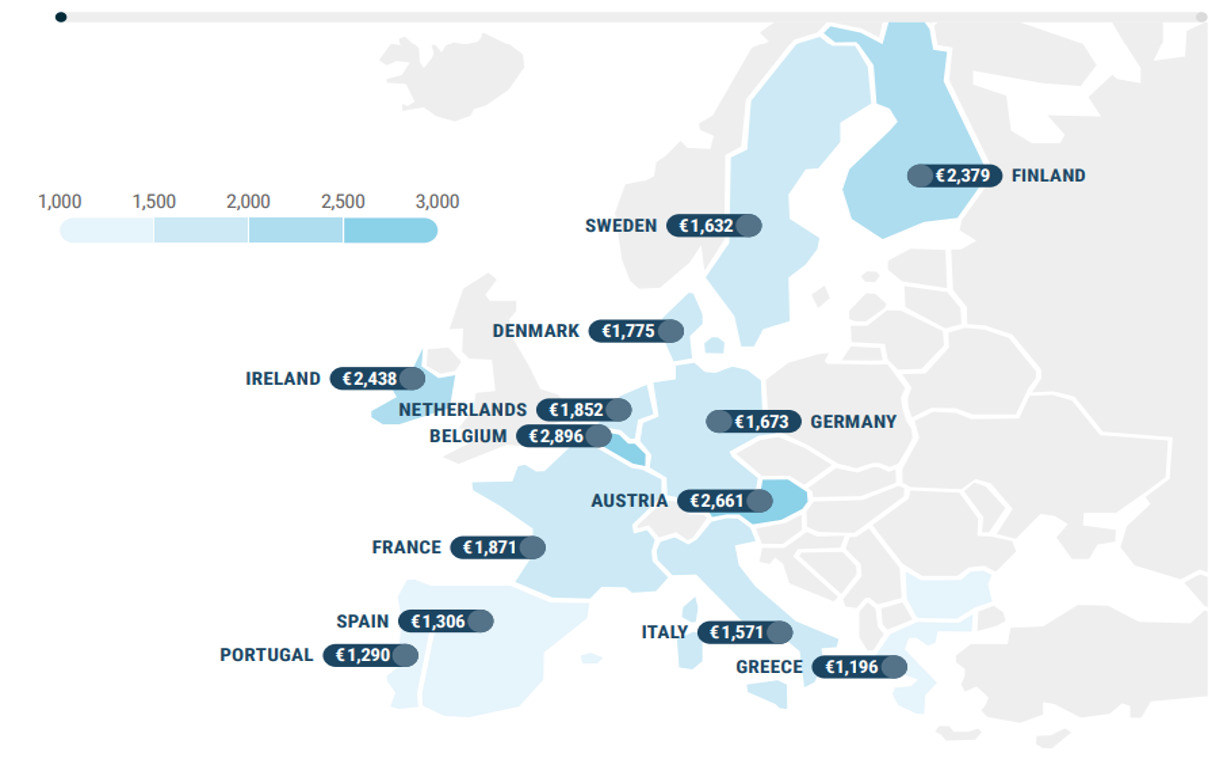
8.3 Average annual tax per vehicle in major EU countries*
Source: ACEA
“* Per country estimates based on total number of
vehicles on roads”
8.4 Excise duties on fuels in EU countries (EUR/1000 litres)
| 1 January 2025 | 1 January 2024 | % change 2022-2024 | ||||
| Unleaded | Diesel | Unleaded Petrol | Diesel | Unleaded Petrol | Diesel | |
| AT | 482 | 397 | 482 | 397 | 0.0% | 0.0% |
| BE | 600 | 600 | 600 | 600 | 0.0% | 0.0% |
| DE** | 655 | 470 | 655 | 470 | 0.0% | 0.0% |
| DK | 710 | 565 | 683 | 475 | 3.8% | 18.9% |
| EL | 700 | 410 | 700 | 410 | 0.0% | 0.0% |
| ES | 504 | 379 | 504 | 379 | 0.0% | 0.0% |
| FI | 685 | 504 | 684 | 492.3 | 0.1% | 2.4% |
| FR | 683 | 594 | 683 | 594 | 0.0% | 0.0% |
| HR | 512 | 406 | 456 | 383 | 10.9% | 6.0% |
| IE | 688 | 596 | 606 | 527 | 11.9% | 13.1% |
| IT | 713 | 632 | 728 | 617 | -2.1% | 2.4% |
| LU | 559 | 452 | 549 | 441 | 1.8% | 2.5% |
| NL | 789 | 516 | 789 | 516 | 0.0% | 0.0% |
| PT | 634 | 504 | 578 | 443 | 8.8% | 13.8% |
| SE | 423 | 350 | 493 | 362 | -16.5% | -3.3% |
| BG | 363 | 330 | 363 | 330 | 0.0% | 0.0% |
| CY | 429 | 400 | 359 | 330 | 16.3% | 21.2% |
| CZ | 508 | 394 | 525 | 407 | -3.3% | -3.2% |
| EE | 591 | 428 | 563 | 372 | 4.7% | 15.1% |
| HU | 399 | 374 | 393 | 368 | 1.5% | 1.6% |
| LT | 513 | 520 | 466 | 410 | 9.2% | 26.8% |
| LV | 532 | 441 | 509 | 414 | 4.3% | 6.5% |
| MT | 359 | 330 | 359 | 330 | 0.0% | 0.0% |
| PL | 423 | 391 | 391 | 360 | 7.6% | 8.6% |
| RO | 559 | 512 | 406 | 372 | 27.4% | 37.6% |
| SI | 597 | 545 | 529 | 459 | 11.4% | 18.7% |
| SK | 514 | 368 | 514 | 368 | 0.0% | 0.0% |
| EU 27 average | 560 | 460 | 540 | 431 | 0.04 | -0.06 |
Source: EC, DG taxud
8.5 Consumer prices of petroleum products inclusive of duties and taxes in EU (€/litre)
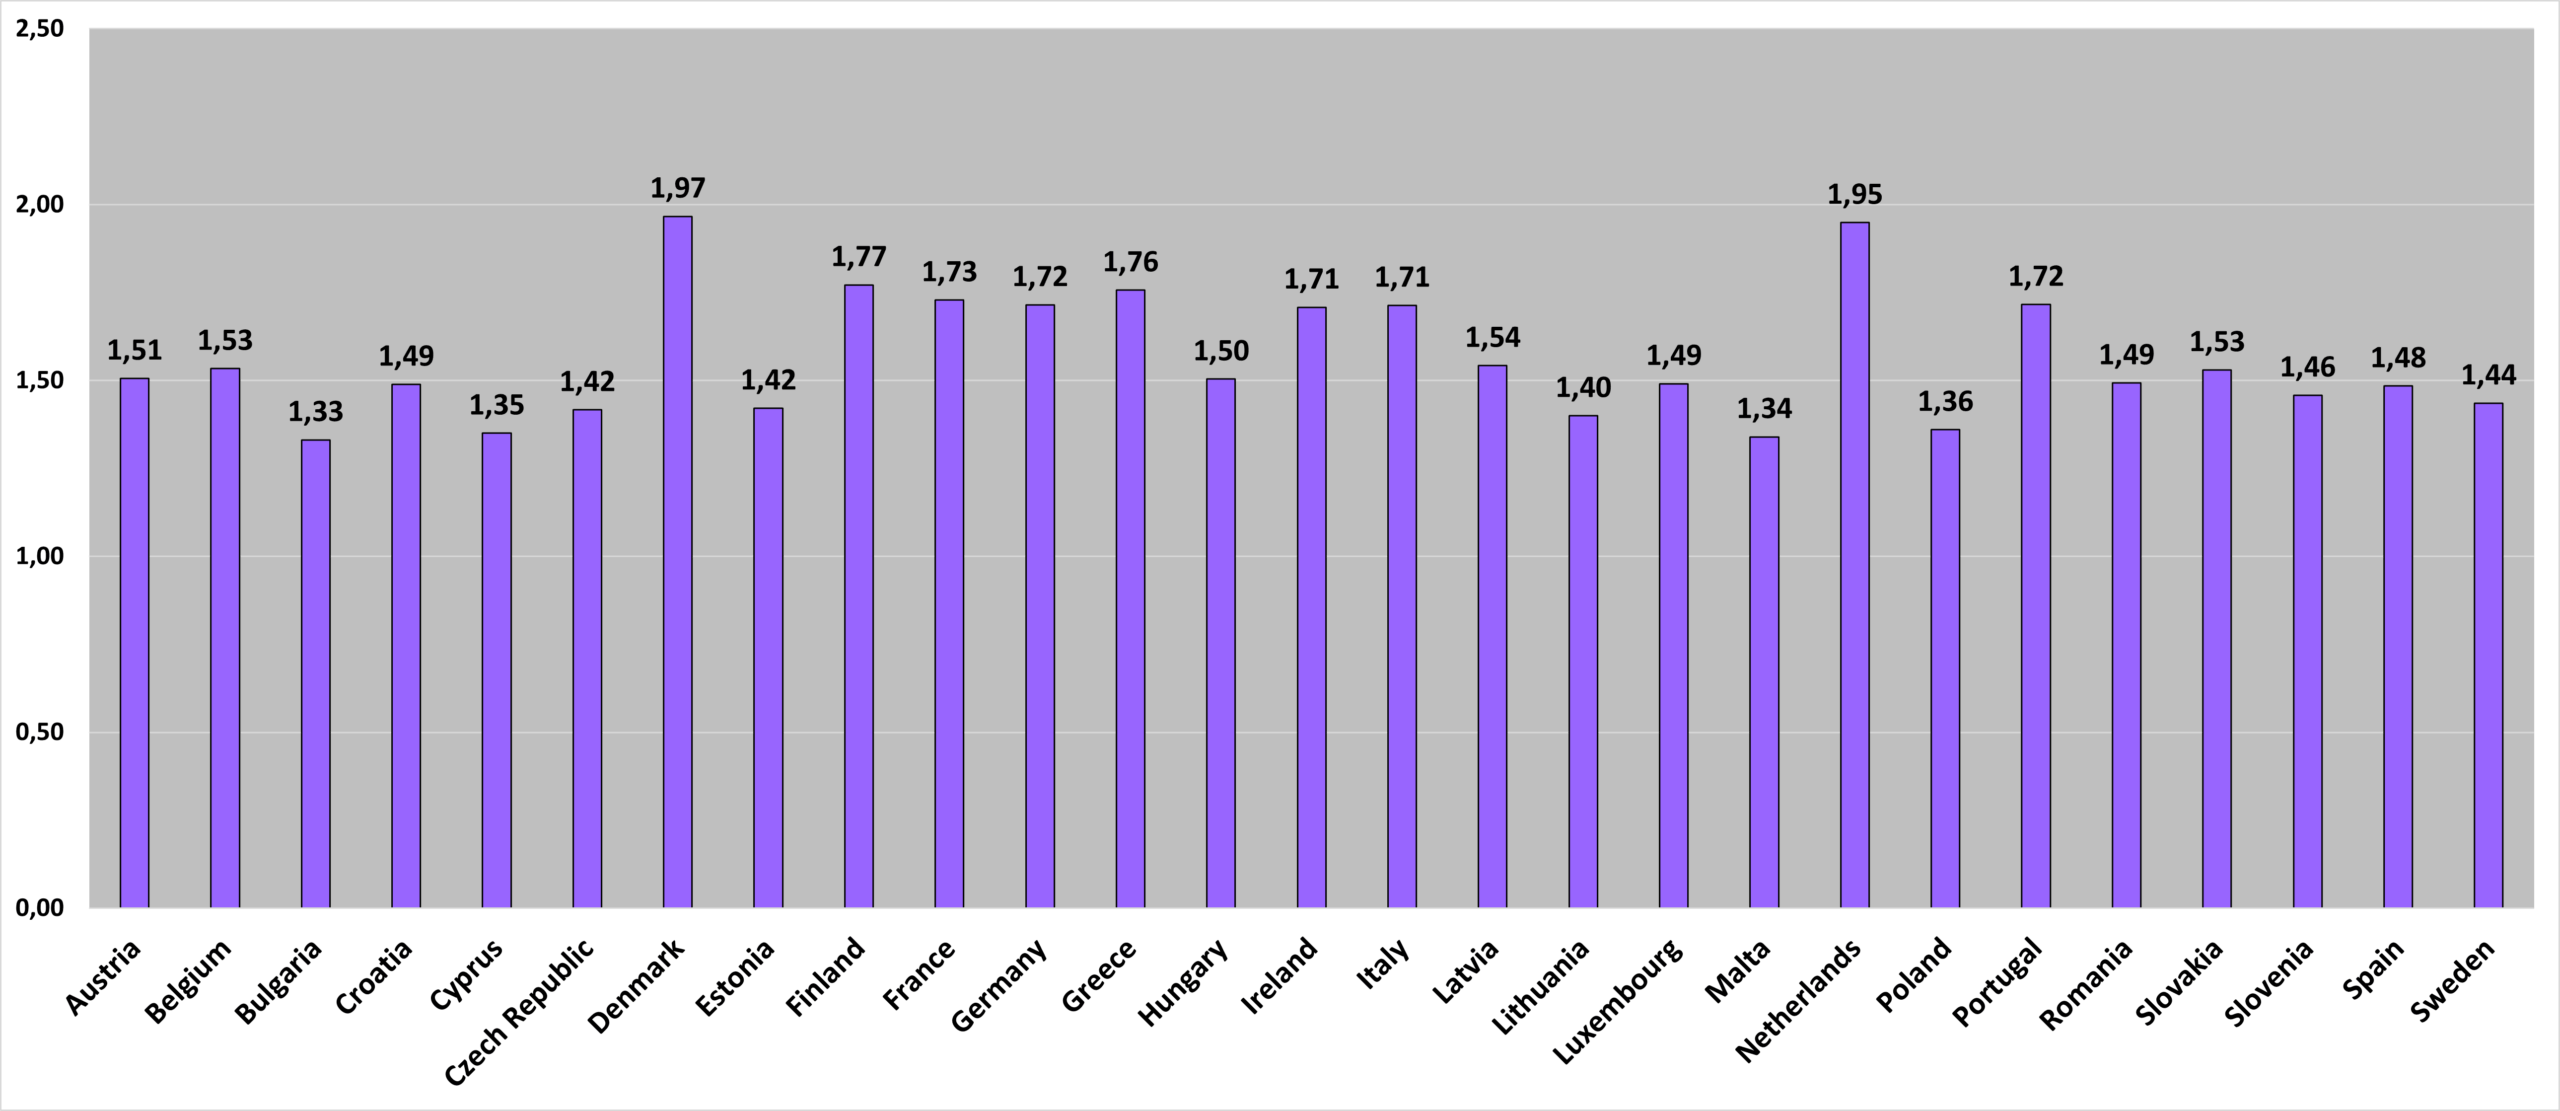
8.5.1 Consumer prices of automotive diesel in EU countries, 2025 (€/litre)
Source: EC
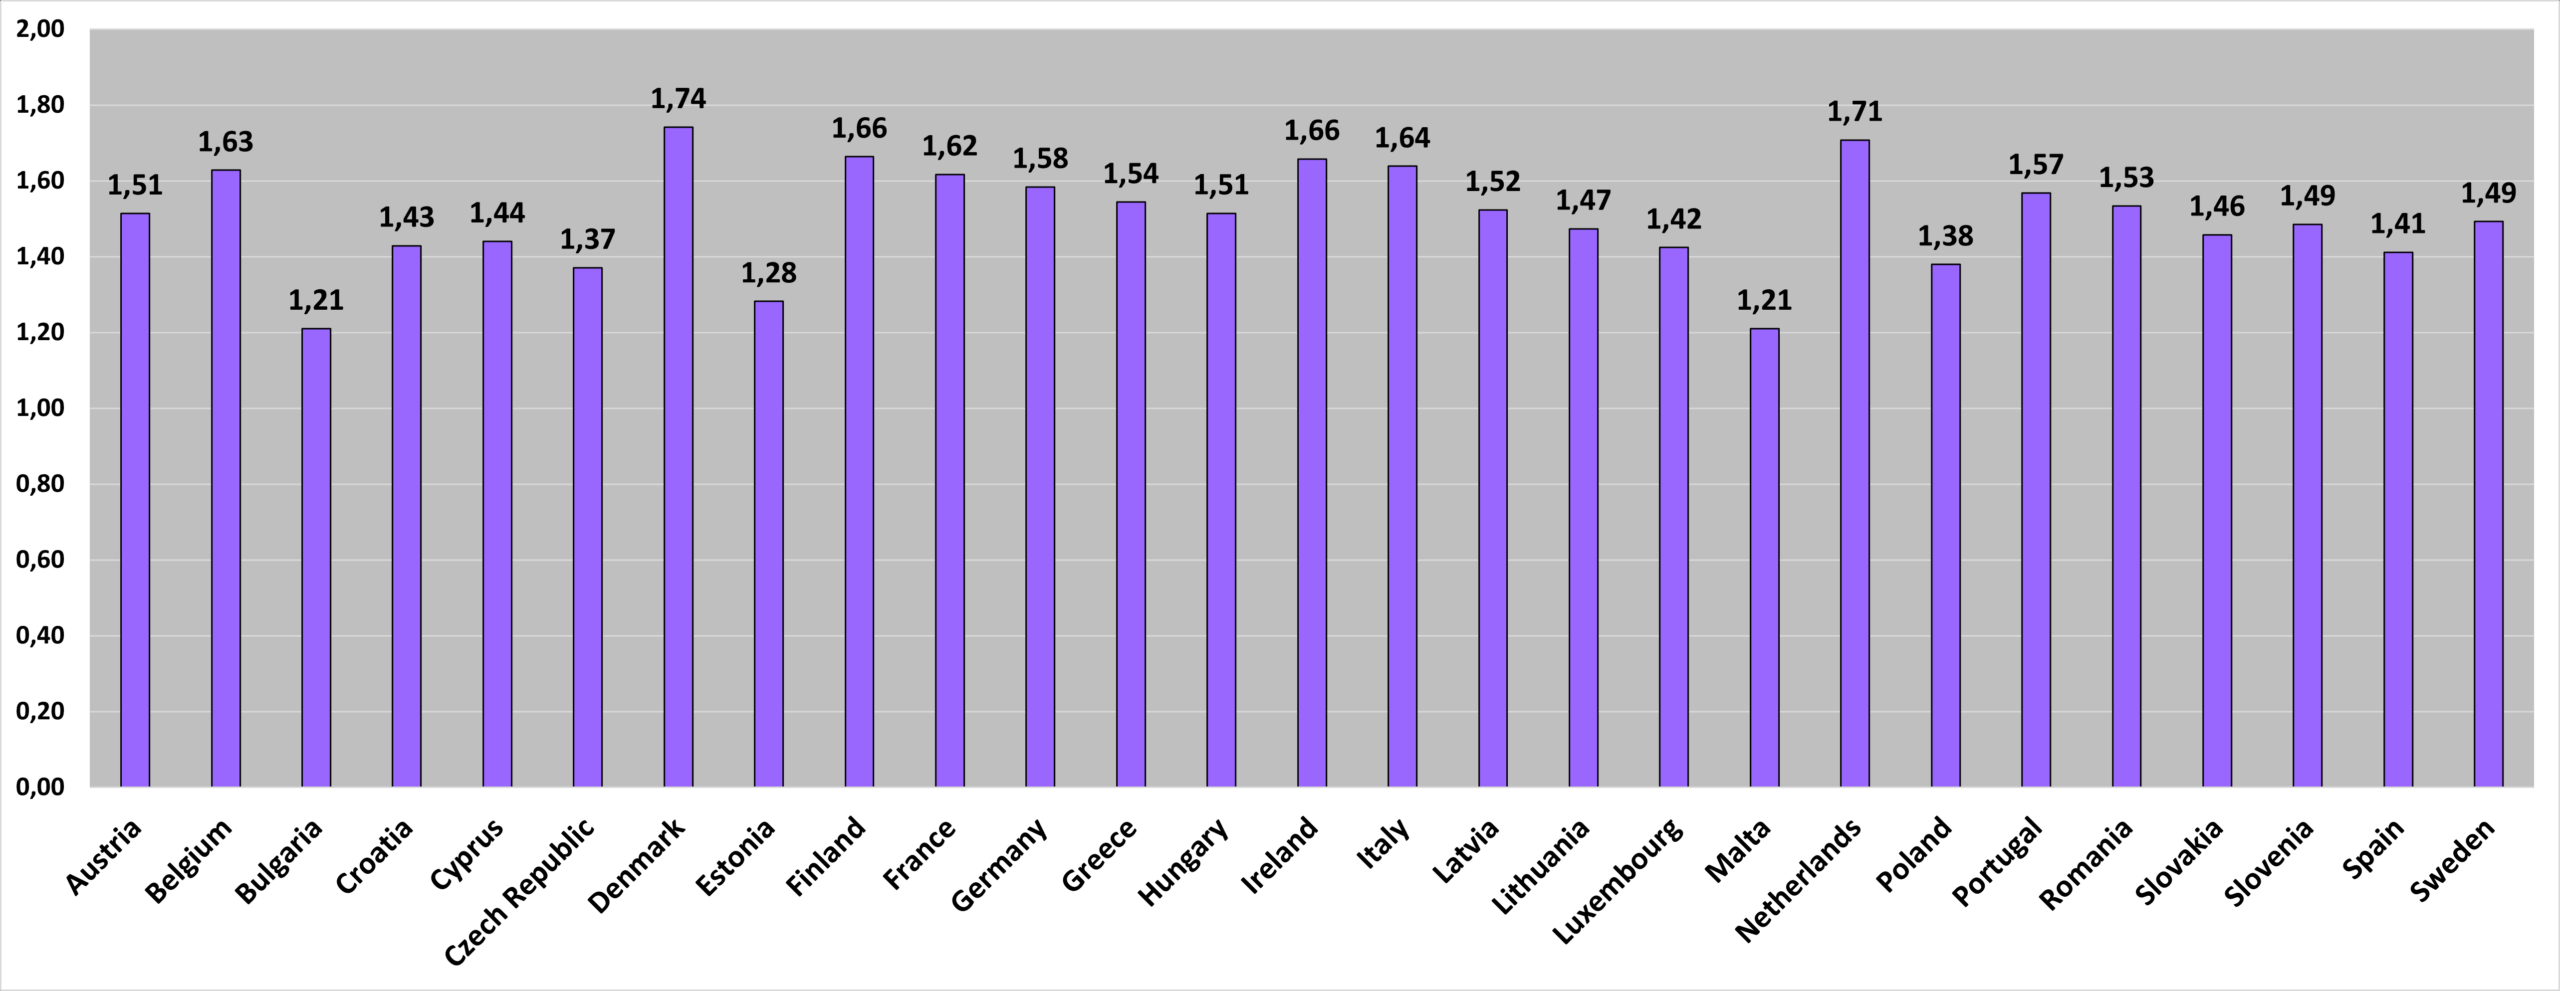
8.5.2 Consumer prices of euro-super 95 in EU countries, 2025 (€/litre)
Source: EC


