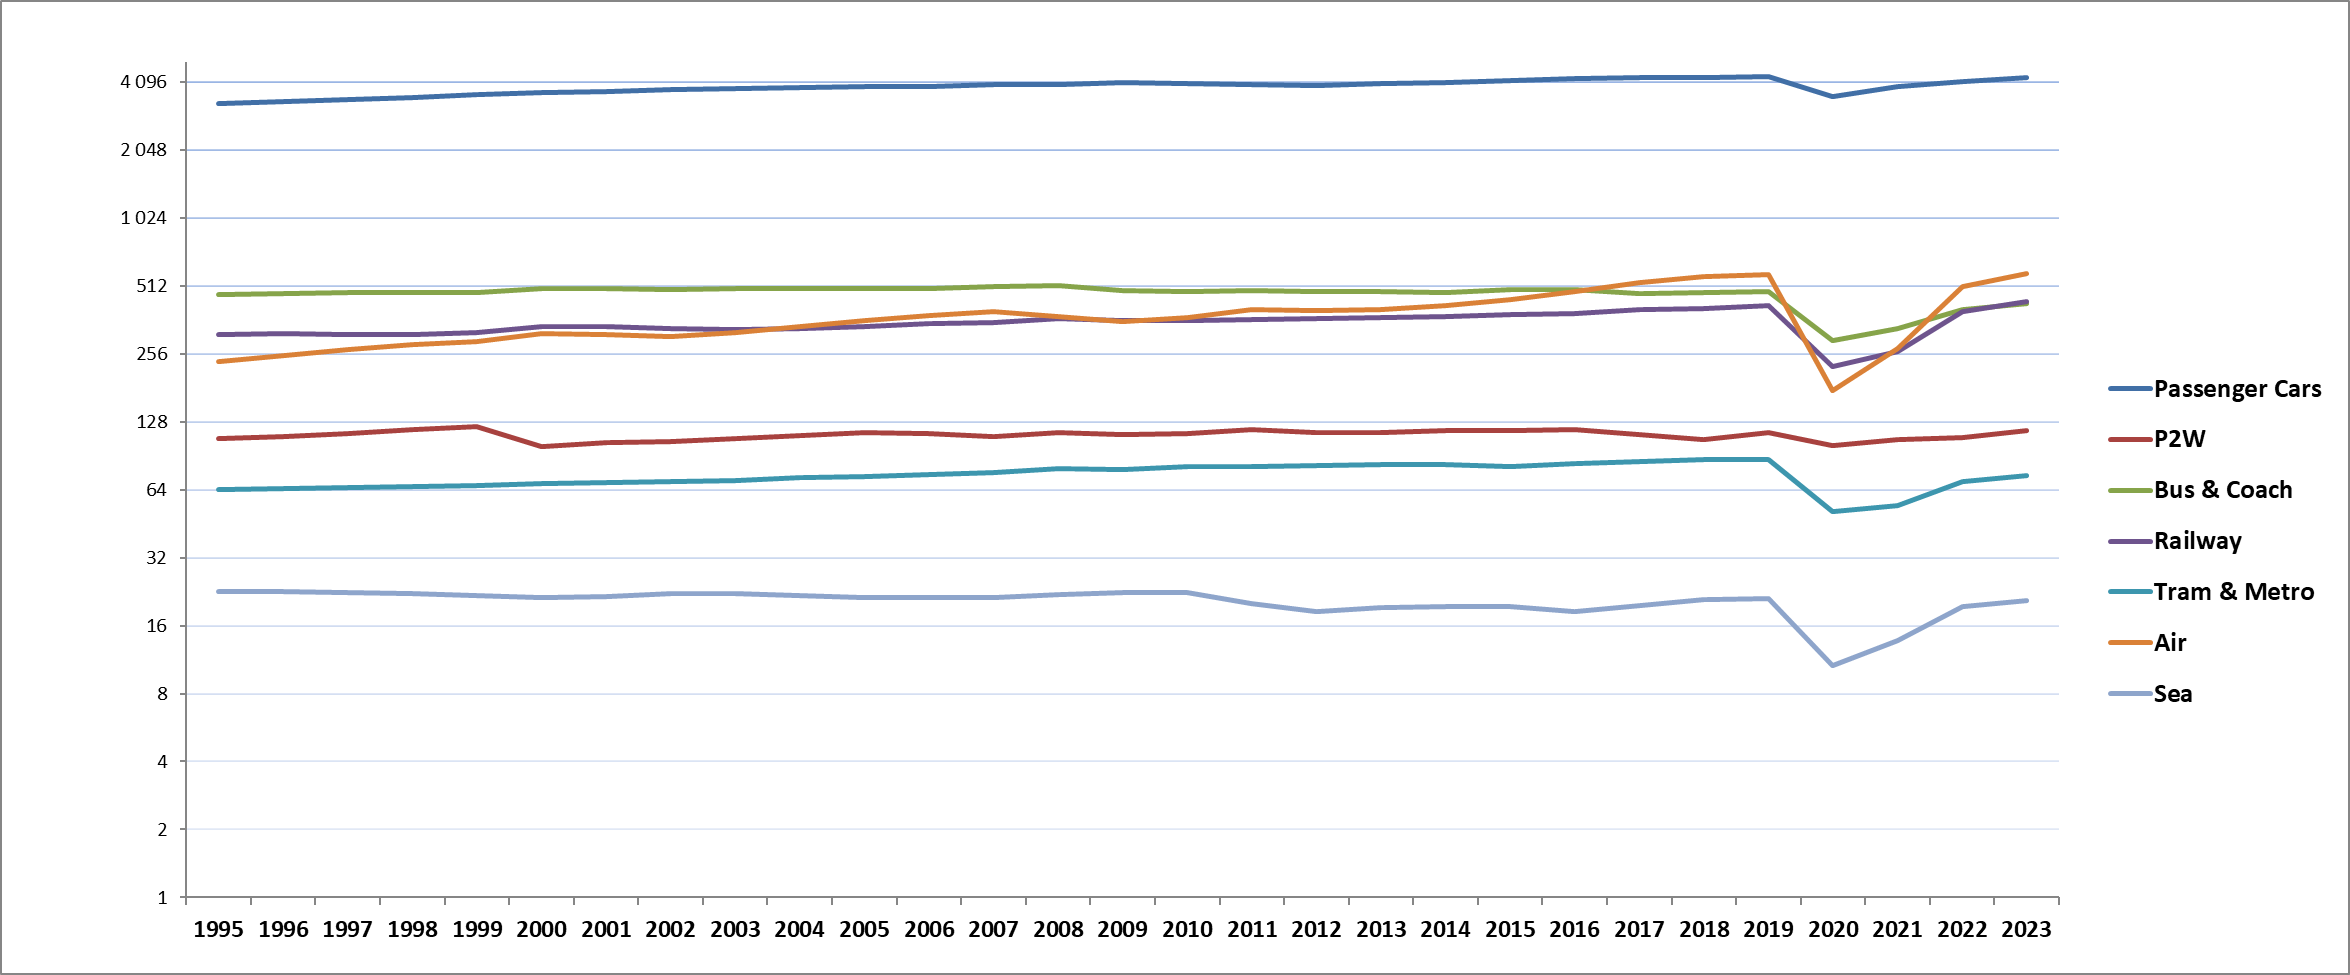
6.1 Transport of passengers by mode in EU 27, 1995-2023 (billion pkm)
| Passenger Cars | P2W | Bus & Coach | Railway | Tram & Metro | Air | Sea | Total | |
| 1995 | 3 286 | 108 | 468 | 313 | 64 | 237 | 23 | 4 500 |
| 1996 | 3 346 | 110 | 473 | 315 | 65 | 251 | 23 | 4 583 |
| 1997 | 3 415 | 114 | 476 | 313 | 65 | 267 | 22 | 4 673 |
| 1998 | 3 509 | 118 | 479 | 312 | 66 | 280 | 22 | 4 786 |
| 1999 | 3 613 | 121 | 480 | 317 | 67 | 291 | 22 | 4 911 |
| 2000 | 3 662 | 99 | 497 | 339 | 68 | 313 | 21 | 5 000 |
| 2001 | 3 736 | 103 | 496 | 340 | 69 | 311 | 22 | 5 076 |
| 2002 | 3 791 | 105 | 493 | 332 | 69 | 305 | 22 | 5 117 |
| 2003 | 3 827 | 108 | 496 | 327 | 70 | 317 | 22 | 5 167 |
| 2004 | 3 879 | 111 | 501 | 332 | 72 | 338 | 22 | 5 255 |
| 2005 | 3 896 | 115 | 498 | 340 | 73 | 361 | 21 | 5 304 |
| 2006 | 3 928 | 114 | 498 | 349 | 75 | 376 | 21 | 5 362 |
| 2007 | 3 985 | 110 | 508 | 353 | 76 | 392 | 21 | 5 446 |
| 2008 | 3 999 | 114 | 515 | 367 | 79 | 376 | 22 | 5 472 |
| 2009 | 4 074 | 112 | 490 | 359 | 78 | 355 | 22 | 5 491 |
| 2010 | 4 035 | 114 | 483 | 358 | 81 | 371 | 22 | 5 463 |
| 2011 | 4 006 | 118 | 486 | 364 | 81 | 402 | 20 | 5 477 |
| 2012 | 3 966 | 115 | 482 | 367 | 82 | 396 | 19 | 5 428 |
| 2013 | 4 023 | 115 | 481 | 372 | 82 | 400 | 19 | 5 492 |
| 2014 | 4 063 | 117 | 476 | 376 | 83 | 420 | 19 | 5 555 |
| 2015 | 4 160 | 117 | 491 | 381 | 81 | 445 | 19 | 5 695 |
| 2016 | 4 250 | 119 | 494 | 388 | 83 | 485 | 18 | 5 838 |
| 2017 | 4 275 | 112 | 475 | 401 | 85 | 530 | 20 | 5 898 |
| 2018 | 4 299 | 107 | 479 | 406 | 87 | 562 | 21 | 5 960 |
| 2019 | 4 351 | 115 | 484 | 419 | 87 | 575 | 21 | 6 053 |
| 2020 | 3 532 | 101 | 292 | 225 | 51 | 176 | 11 | 4 387 |
| 2021 | 3 903 | 107 | 331 | 261 | 54 | 270 | 14 | 4 940 |
| 2022 | 4 118 | 108 | 404 | 395 | 69 | 511 | 19 | 5 625 |
| 2023 | 4 272 | 117 | 428 | 437 | 74 | 582 | 21 | 5 932 |
| 1995 -2023 | 30.0% | 8.4% | -8.6% | 39.9% | 15.8% | 145.3% | -9.0% | 31.8% |
| per year | 0.9% | 0.3% | -0.3% | 1.2% | 0.5% | 3.3% | -0.3% | 1.0% |
| 2000-2023 | 16.7% | 18.1% | -13.8% | 29.2% | 8.9% | 85.7% | -3.1% | 18.6% |
| per year | 0.7% | 0.7% | -0.6% | 1.1% | 0.5% | 2.7% | -0.1% | 0.7% |
| 2022-2023 | 3.7% | 8.1% | 6.0% | 10.8% | 6.7% | 13.9% | 6.2% | 5.4% |
Source: EC
Notes:
Air and Sea: only domestic and intra-EU-27 transport; estimates for air and for sea based on Eurostat data. The time series for maritime activity from 1995 to 2004 and for aviation activity from 1995 to 2007 have been recalibrated by DG MOVE in line with the new EU-27 figures to avoid break in series.
P2W: Powered two-wheelers
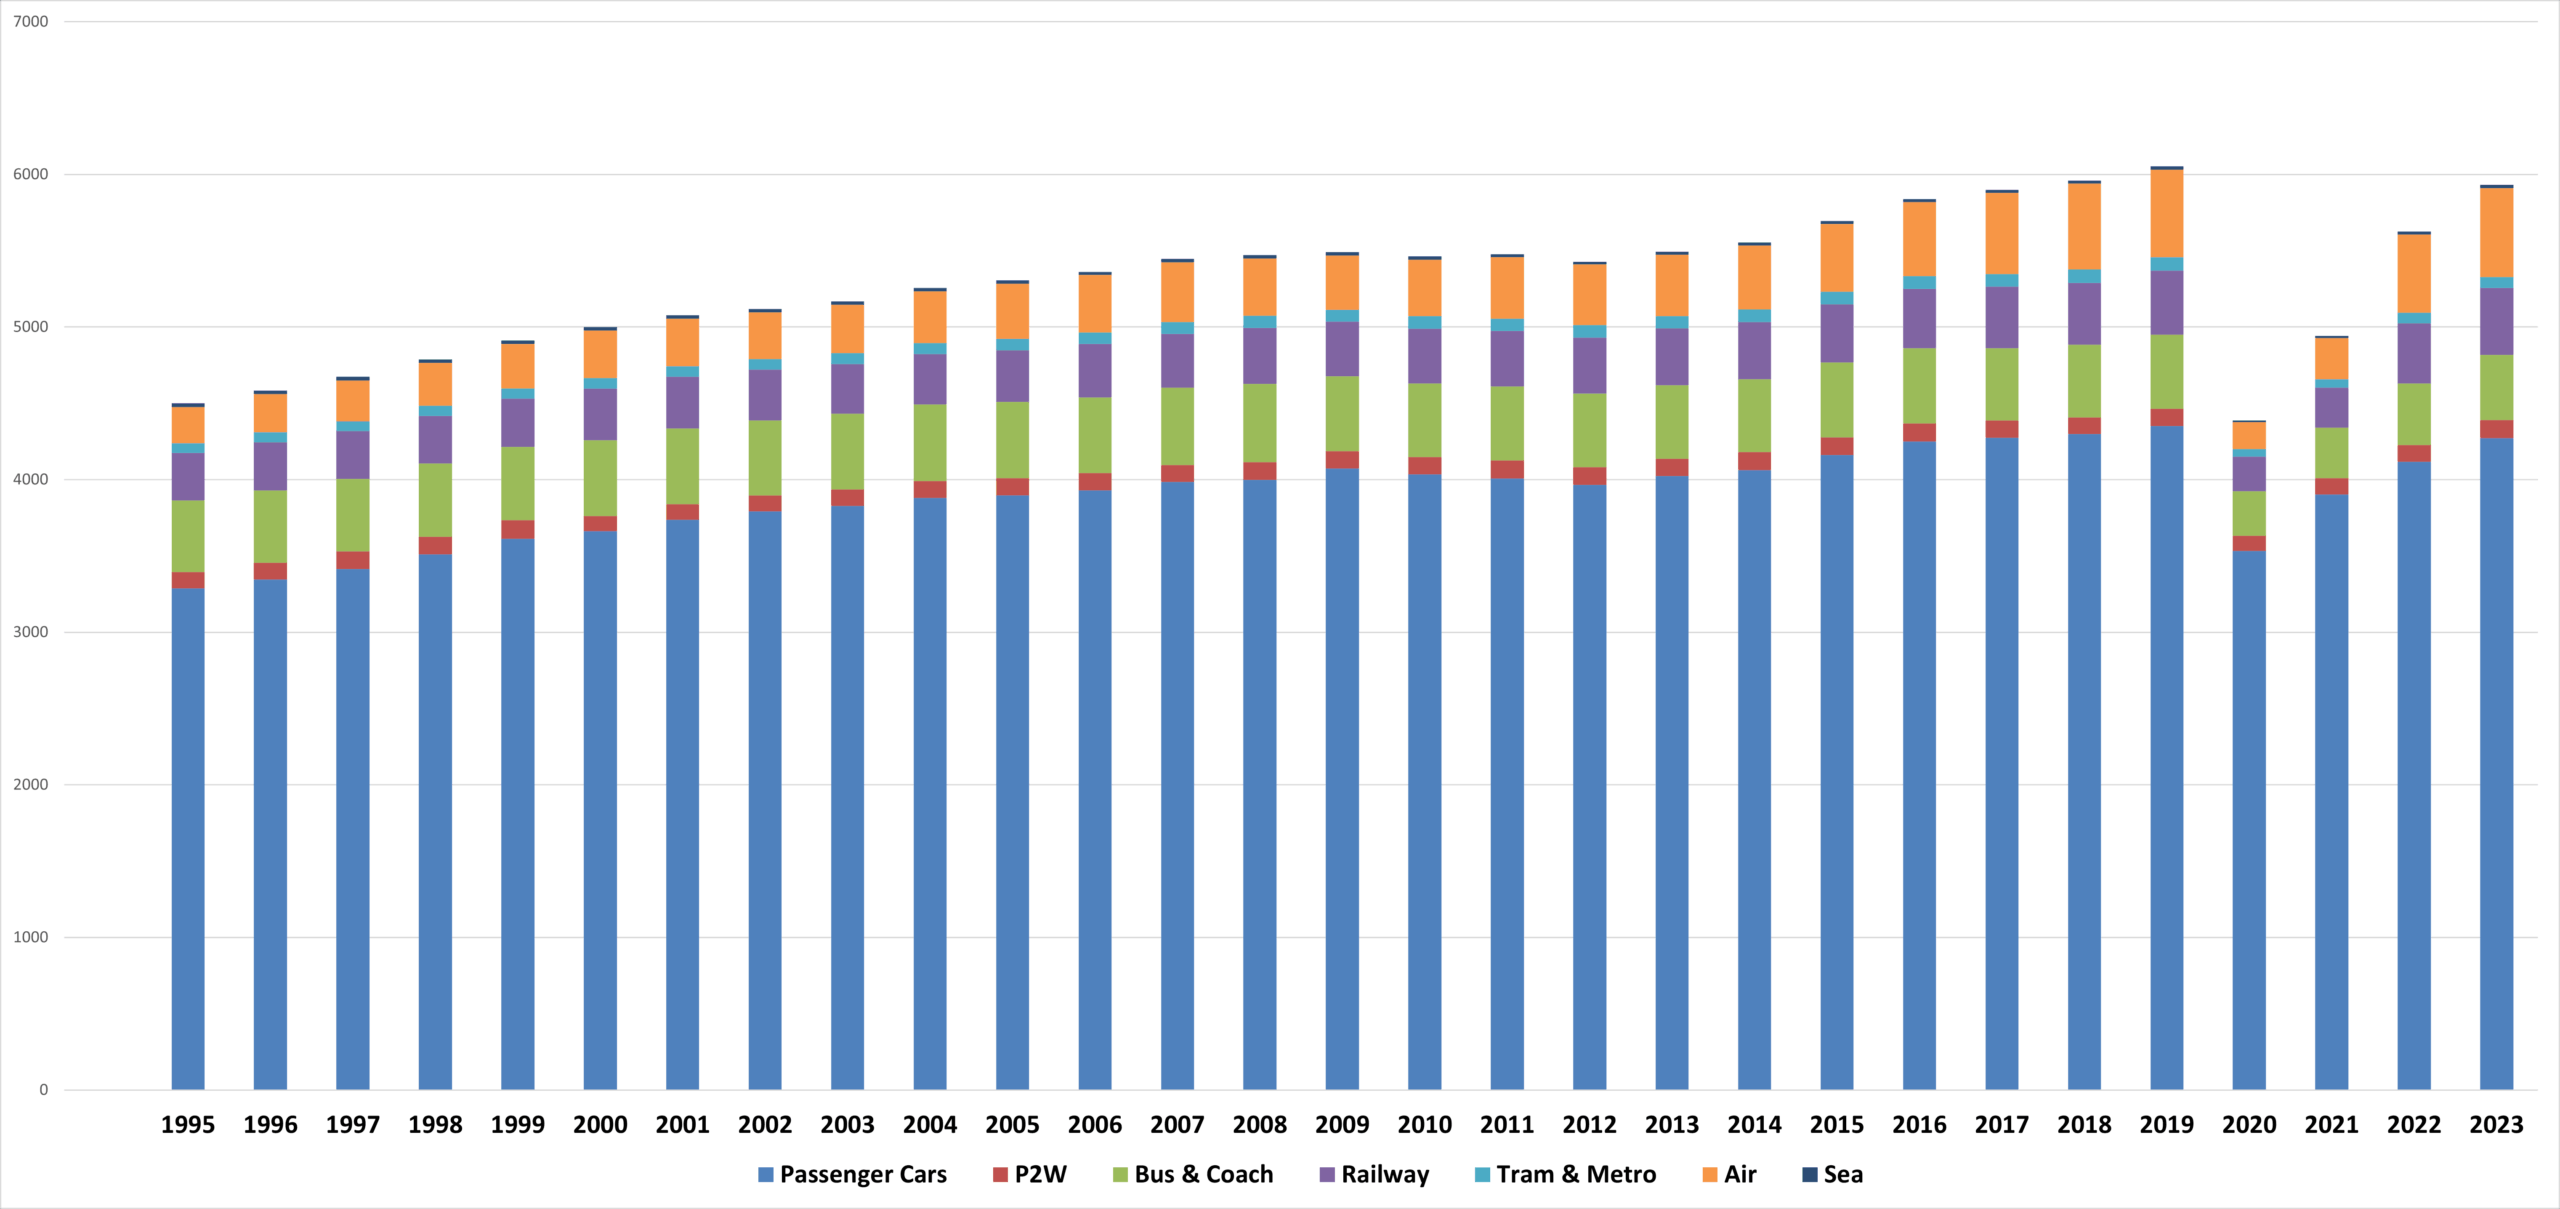
6.2 Evolution of passenger transport by mode in EU 27, 1995-2023
Source: EC
Notes:
Air and Sea: only domestic and intra-EU-27 transport; estimates for air and for sea based on Eurostat data. The time series for maritime activity from 1995 to 2004 and for aviation activity from 1995 to 2007 have been recalibrated by DG MOVE in line with the new EU-27 figures to avoid break in series.
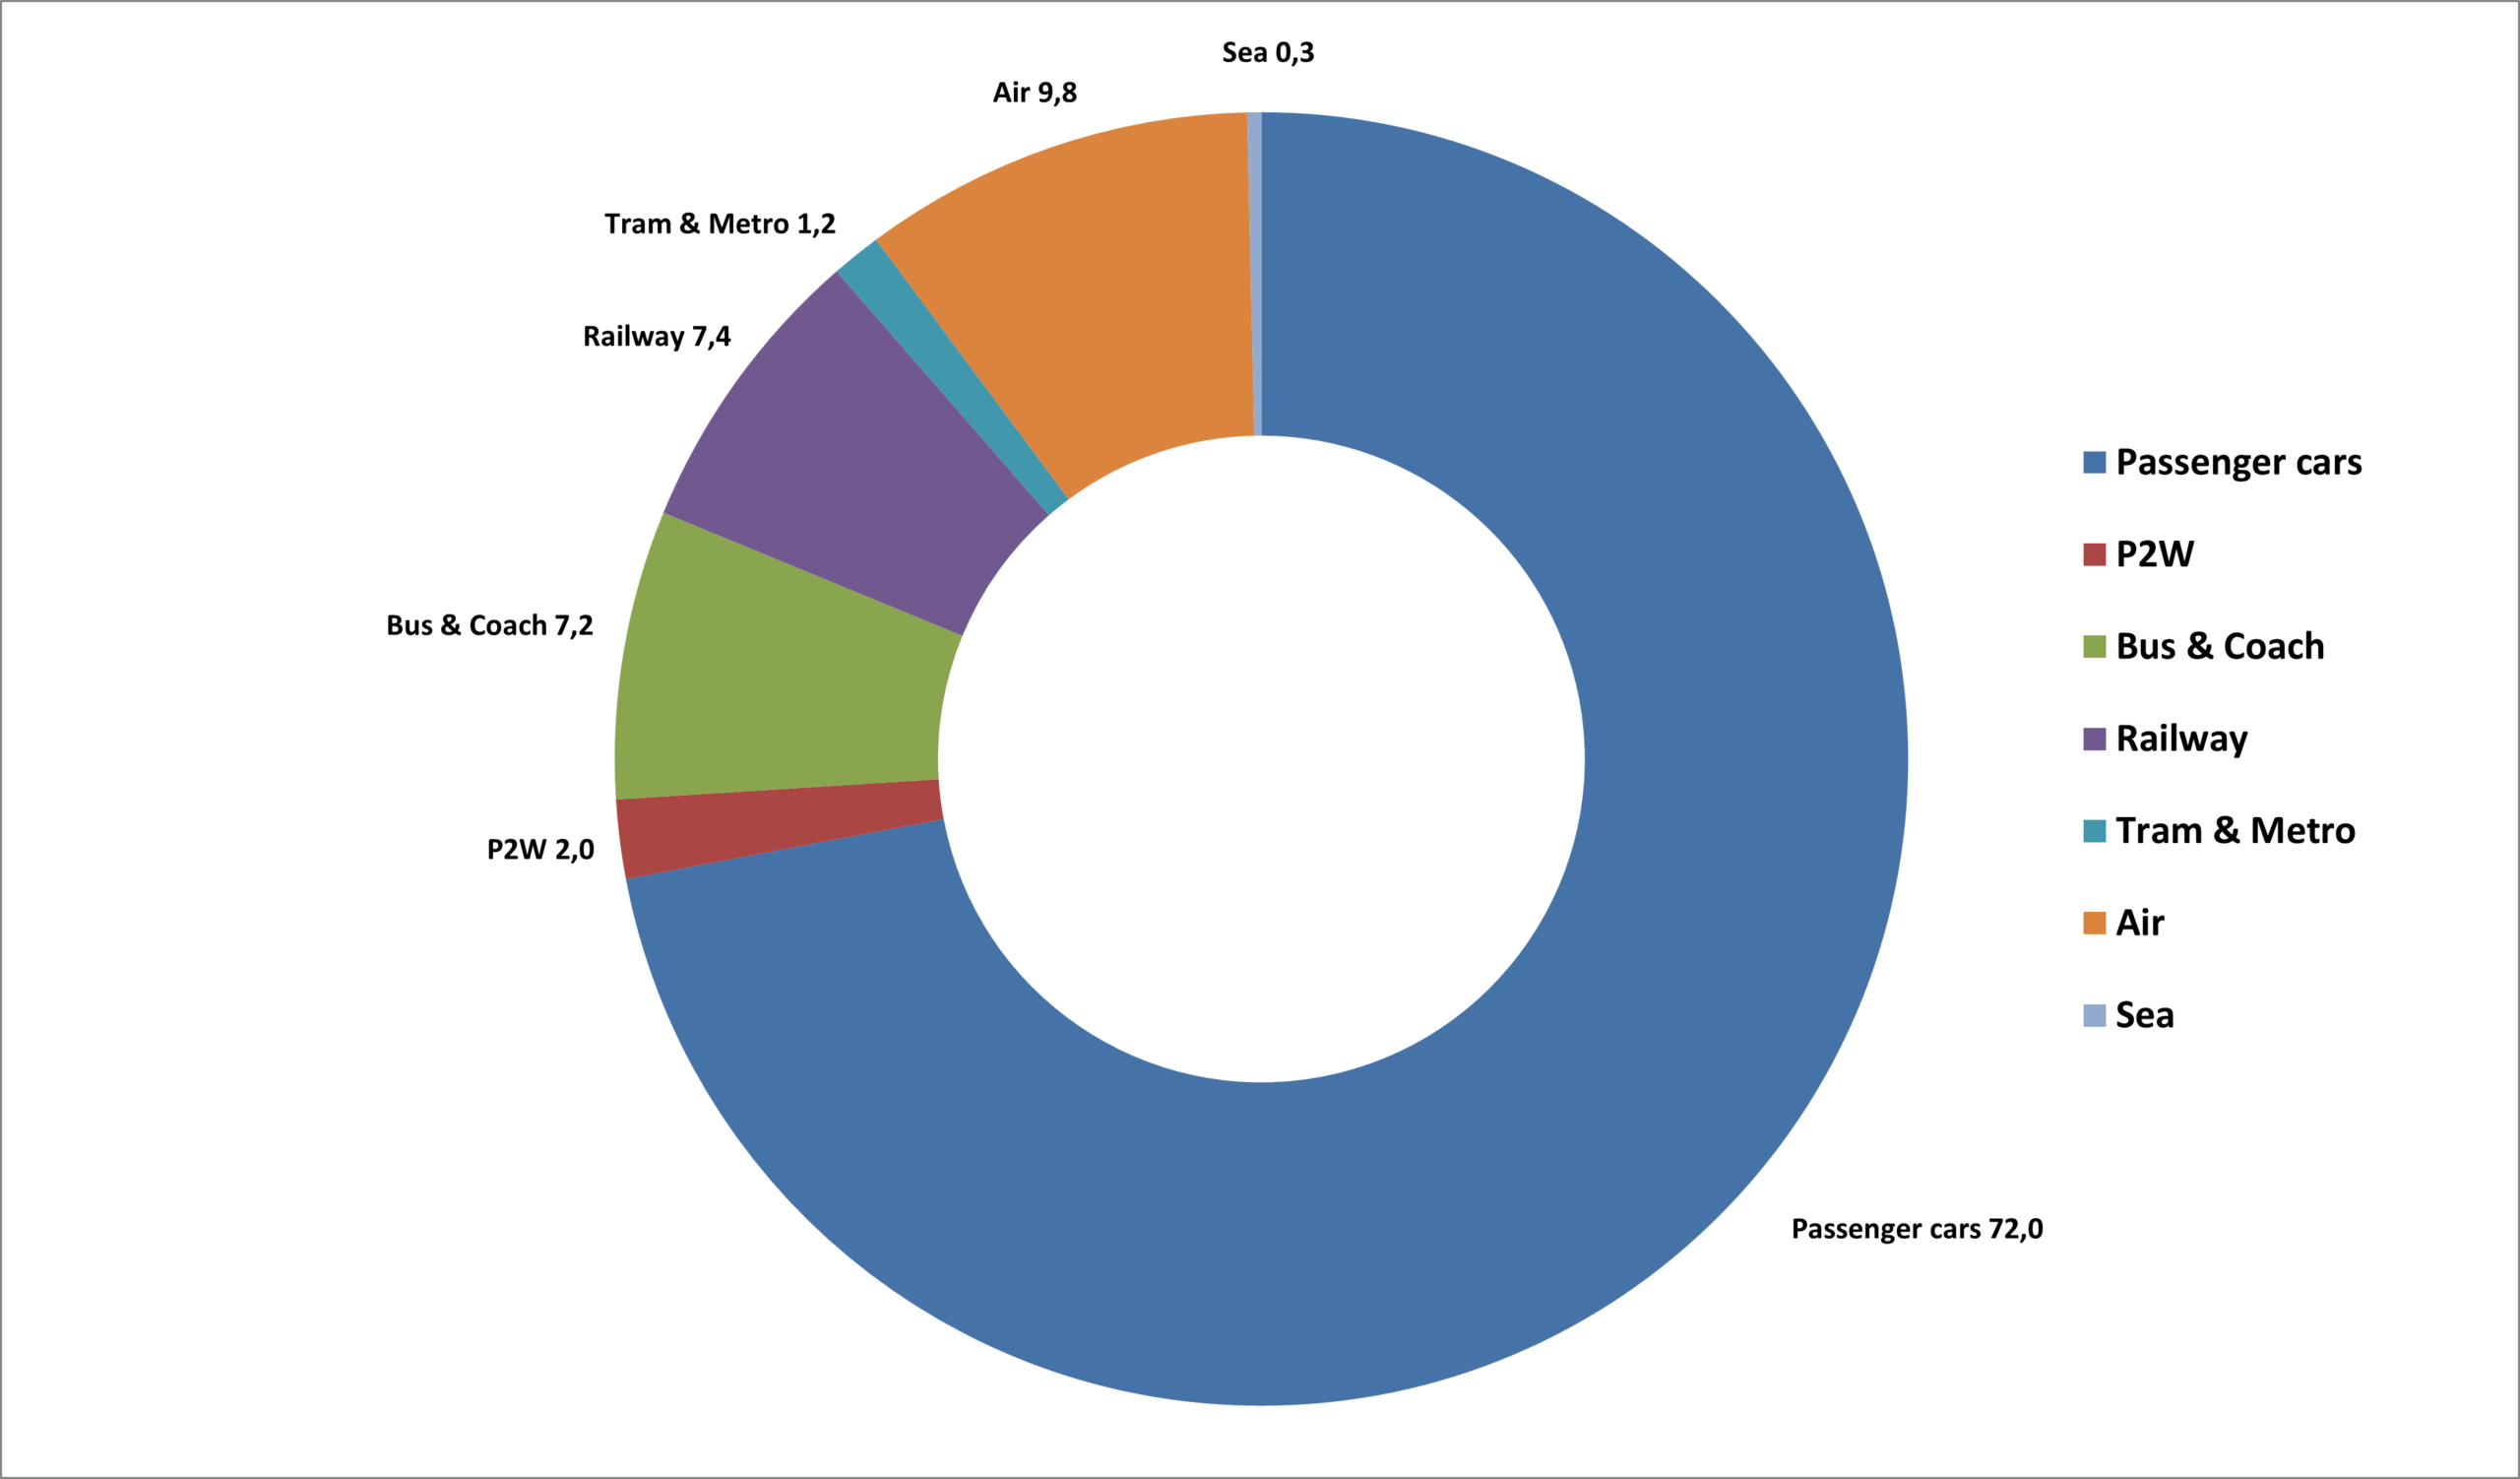
6.3 Passenger transport modal split in EU 27, 2023 (pkm in %)
Source: EC
Notes:
Air and Sea: only domestic and intra-EU-27 transport; estimates for air and for sea based on Eurostat data. The time series for maritime activity from 1995 to 2004 and for aviation activity from 1995 to 2007 have been recalibrated by DG MOVE in line with the new EU-27 figures to avoid break in series.
P2W: Powered two-wheelers
6.4 Modal split of passenger transport on land by country in EU countries, 2023 ( billion pkm and pkm in %)
| Passenger cars* (billion pkm) |
Passenger cars (%) | Buses and coaches (billion pkm) |
Buses and coaches (%) | Railways (billion pkm) |
Railways (%) | Urban rail (tram & metro) (billion pkm) |
Urban rail (tram & metro) (%) |
TOTAL (billion pkm) |
|
| BE | 105.3 | 79.54 | 13.5 | 10.17 | 12.3 | 9.32 | 1.3 | 0.01 | 132.4 |
| BG | 59.0 | 85.98 | 7.0 | 10.14 | 1.6 | 2.32 | 1.1 | 0.02 | 68.6 |
| CZ | 89.5 | 76.92 | 11.7 | 10.02 | 10.0 | 8.59 | 5.2 | 0.04 | 116.4 |
| DK | 62.3 | 81.22 | 7.8 | 10.21 | 6.0 | 7.87 | 0.5 | 0.01 | 76.7 |
| DE | 863.6 | 83.78 | 50.2 | 4.87 | 101.4 | 9.84 | 15.6 | 0.02 | 1030.8 |
| EE | 14.7 | 83.14 | 2.5 | 13.95 | 0.4 | 2.31 | 0.1 | 0.01 | 17.6 |
| IE | 59.8 | 79.24 | 13.2 | 17.53 | 2.2 | 2.96 | 0.2 | 0.00 | 75.5 |
| EL | 109.4 | 83.83 | 18.9 | 14.49 | 0.7 | 0.52 | 1.5 | 0.01 | 130.5 |
| ES | 396.2 | 82.36 | 42.2 | 8.76 | 34.6 | 7.20 | 8.0 | 0.02 | 481.0 |
| FR | 760.8 | 81.72 | 52.9 | 5.68 | 107.0 | 11.49 | 10.4 | 0.01 | 931.0 |
| HR | 24.0 | 82.91 | 3.5 | 12.01 | 1.1 | 3.94 | 0.3 | 0.01 | 29.0 |
| IT | 674.2 | 82.67 | 80.8 | 9.91 | 54.8 | 6.72 | 5.7 | 0.01 | 815.5 |
| CY | 7.3 | 83.50 | 1.5 | 16.50 | – | — | – | — | 8.8 |
| LV | 13.4 | 83.83 | 1.9 | 11.82 | 0.6 | 3.83 | 0.1 | 0.01 | 16.0 |
| LT | 34.8 | 92.13 | 2.6 | 6.83 | 0.4 | 1.04 | – | — | 37.8 |
| LU | 8.3 | 81.63 | 1.4 | 13.42 | 0.5 | 4.95 | 0.1 | — | 10.2 |
| HU | 78.3 | 73.48 | 15.1 | 14.14 | 10.4 | 9.76 | 2.8 | 0.03 | 106.6 |
| MT | 2.8 | 82.05 | 0.6 | 17.95 | – | — | – | — | 3.4 |
| NL | 136.1 | 84.85 | 4.3 | 2.68 | 19.2 | 11.97 | 0.8 | 0.01 | 160.4 |
| AT | 81.4 | 72.21 | 10.1 | 8.94 | 14.4 | 11.40 | 6.8 | 0.06 | 112.7 |
| PL | 247.9 | 80.93 | 28.5 | 9.30 | 25.8 | 6.70 | 4.2 | 0.01 | 306.4 |
| PT | 100.5 | 87.21 | 8.6 | 7.43 | 4.8 | 4.10 | 1.3 | 0.01 | 115.2 |
| RO | 124.0 | 77.91 | 24.5 | 15.39 | 6.2 | 4.50 | 4.5 | 0.03 | 159.2 |
| SI | 24.7 | 85.52 | 3.4 | 11.92 | 0.7 | 2.50 | – | — | 28.9 |
| SK | 30.2 | 77.50 | 4.9 | 12.45 | 3.5 | 7.00 | 0.4 | 0.01 | 39.0 |
| FI | 61.0 | 82.33 | 7.3 | 9.85 | 5.2 | 5.20 | 0.6 | 0.01 | 74.1 |
| SE | 102.7 | 80.29 | 9.6 | 7.51 | 13.3 | 8.90 | 2.3 | 0.02 | 127.9 |
| EU 27 | 4272.36 | 81.98% | 428.14 | 8.21% | 437.30 | 8.39% | 73.90 | 1.42% | 5,211.70 |
Source: national statistics, International Transport Forum, Eurostat, , study for DG Energy and Transport
6.5 Passenger vehicles in EU countries, 2023
| Stock of registered passenger cars (thousand) |
Stock of registered PTW (thousand) |
Stock of registered buses & coaches (thousand) | |
| BE | 6,047.6 | 828.0 | 16.5 |
| BG | 3,006.2 | 238.8 | 17.9 |
| CZ | 6,512.8 | 1,788.0 | 22.1 |
| DK | 2,827.9 | 195.7 | 10.8 |
| DE | 49,098.7 | 4,992.6 | 84.6 |
| EE | 865.8 | 70.3 | 5.2 |
| IE | 2,404.1 | 48.6 | 14.1 |
| EL | 5,877.8 | 1,782.0 | 26.6 |
| ES | 26,778.1 | 5,955.3 | 67.4 |
| FR | 39,258.6 | 2,910.3 | 93.9 |
| HR | 1,910.1 | 174.8 | 5.8 |
| IT | 40,915.2 | 10,508.9 | 100.1 |
| CY | 625.6 | 43.2 | 3.1 |
| LV | 781.7 | 77.3 | 4.0 |
| LT | 1,700.5 | 87.7 | 7.6 |
| LU | 453.6 | 36.0 | 2.6 |
| HU | 4,168.7 | 221.4 | 17.5 |
| MT | 323.9 | 44.1 | 2.5 |
| NL | 9,067.4 | 1,891.7 | 8.7 |
| AT | 5,185.0 | 947.5 | 10.4 |
| PL | 21,796.9 | 3,382.0 | 132.4 |
| PT | 5,847.6 | 825.7 | 16.5 |
| RO | 8,106.6 | 208.7 | 56.0 |
| SI | 1,230.6 | 162.1 | 2.9 |
| SK | 2,644.4 | 178.5 | 8.7 |
| FI | 3,718.3 | 659.6 | 19.6 |
| SE | 4,976.4 | 740.8 | 14.3 |
| EU 27 | 256,129.9 | 38,999.5 | 771.8 |
Source: EC
6.6 Passenger cars per 1.000 inhabitants in EU countries, 2024
| Motorisation (number of passenger cars per 1.000 inhabitants) | |
| BE | 513 |
| BG | 484 |
| CZ | 608 |
| DK | 478 |
| DE | 590 |
| EE | 635 |
| IE | 466 |
| EL | 579 |
| ES | 544 |
| FR | 576 |
| HR | 513 |
| IT | 701 |
| CY | 661 |
| LV | 424 |
| LT | 598 |
| LU | 670 |
| HU | 447 |
| MT | 576 |
| NL | 513 |
| AT | 569 |
| PL | 611 |
| PT | 567 |
| RO | 444 |
| SI | 587 |
| SK | 502 |
| FI | 666 |
| SE | 470 |
| EU 27 | 576 |
Source: Eurostat
6.7 Motorcycle registrations in EU countries, 2016-2024
| 2016 | 2017 | 2018 | 2019 | 2020 | 2021 | 2022 | 2023 | 2024 | |
| BE | 26,015 | 22,948 | 25,281 | 25,503 | 26,727 | 26,645 | 25,563 | 25,490 | 29,495 |
| BG | 850 | 829 | 900 | 970 | 824 | 1,106 | 1,464 | 2,096 | 2,837 |
| CZ | 17,842 | 15,915 | 17,268 | 18,697 | 21,508 | 22,011 | 23,137 | 24,150 | 27,038 |
| DK | 2,987 | 2,834 | 3,465 | 3,208 | 3,678 | 3,814 | 3,163 | 2,686 | 2,782 |
| DE | 182,066 | 138,286 | 153,287 | 163,370 | 216,401 | 195,257 | 217,866 | 216,649 | 244,886 |
| EE | 1,145 | 671 | 708 | 824 | 913 | 1,132 | 1,536 | 1,611 | 1,514 |
| IE | 1,435 | 1,310 | 1,369 | 1,881 | 1,618 | 2,256 | 2,753 | 2,877 | 2,760 |
| EL | 41,486 | 28,852 | 33,377 | 38,109 | 35,464 | 44,437 | 55,662 | 65,814 | 77,979 |
| ES | 159,640 | 143,398 | 163,035 | 181,760 | 159,982 | 171,775 | 182,294 | 206,151 | 229,000 |
| FR | 182,650 | 175,135 | 188,029 | 207,484 | 201,913 | 217,712 | 205,053 | 242,816 | 253,727 |
| HR | 3,740 | 4,436 | 6,057 | 7,164 | 5,971 | 2,155 | 3,325 | 4,850 | 5,767 |
| IT | 193,072 | 204,850 | 219,673 | 232,326 | 216,979 | 272,040 | 271,062 | 319,748 | 353,093 |
| CY | 1,971 | 1,996 | 2,023 | 1,937 | 2,541 | 2,939 | 2,328 | 2,990 | 3,545 |
| LV | 651 | 628 | 806 | 981 | 1,028 | 1,283 | 1,434 | 1,565 | 1,501 |
| LT | 542 | 489 | 457 | 589 | 730 | 1,105 | 1,579 | 1,610 | 1,744 |
| LU | 1,733 | 1,802 | 1,936 | 2,063 | 2,334 | 2,472 | 2,368 | 2,439 | 2,449 |
| HU | 2,356 | 2,384 | 3,126 | 4,160 | 4,347 | 4,681 | 5,274 | 6,689 | : |
| MT | 2,470 | 2,216 | 2,410 | 2,447 | 2,253 | 3,365 | 4,656 | 3,002 | 2,544 |
| NL | 12,575 | 12,740 | 13,062 | 13,962 | 14,558 | 15,267 | 15,472 | 17,467 | 19,852 |
| AT | 46,840 | 43,556 | 40,417 | 29,877 | 34,638 | 35,177 | 34,175 | 36,850 | 47,848 |
| PL | 25,844 | 15,032 | 14,524 | 19,103 | 21,815 | 21,579 | 23,910 | 27,756 | 39,809 |
| PT | 22,596 | 25,770 | 29,640 | 31,901 | 30,361 | 35,117 | 38,042 | 43,233 | 44,605 |
| RO | 1,957 | 2,107 | 2,692 | 3,908 | 5,811 | 6,220 | 7,778 | 9,144 | 12,972 |
| SI | 2,801 | 2,941 | 3,026 | 3,332 | 3,055 | 3,928 | 5,242 | 6,728 | 6,958 |
| SK | 5,094 | 4,654 | 4,970 | 5,310 | 5,211 | 5,959 | 7,077 | 7,597 | 8,168 |
| FI | 3,107 | 2,927 | 3,285 | 3,396 | 3,717 | 3,709 | 3,800 | 3,543 | 3,228 |
| SE | 19,842 | 11,990 | 12,669 | 12,772 | 14,410 | 11,954 | 12,099 | 11,626 | 14,900 |
| EU 27 | 1,029,160 | 935,562 | 947,492 | 1,017,034 | 1,038,787 | 1,115,095 | 1,158,112 | 1,297,177 | 1,441,001 |
Source: Eurostat
6.8 Transport of passengers per mode - Comparison EU 27/World
| Passenger transport (billion pkm) | EU 27 (2023) | USA (2023) | Japan (2022) | China (2023) | Russia (2023) |
| Passenger car | 4,272.4 | 7,045.7 | — | 474.0 | — |
| Bus, trolley-bus and coach | 427.0 | 603.9 | 44.2 | — | 115.9 |
| Railway | 437.3 | 27.6 | 353 | 1,472.9 | 138.0 |
| Tram and metro | 73.2 | 14.1 | — | — | 44.7 |
| Waterborne | 20.7 | 0.7 | 1.8 | 5.4 | 0.7 |
| Air (domestic/intra EU) | 582.0 | 1,244.8 | 86.4 | 1,030.9 | 264.7 |
Source: Eurostat, Japan Statistics Bureau, US Bureau of Transportation Statisitics, Goskom STAT (Russia), National Bureau of Statistics of China, International Transport Forum
6.9 Motorisation: Comparison EU 27/ World, 2023 ( cars/ 1000 inhabitants)
Source: EC
6.10 Passenger Transport volume and modal split 1995-2023 ( Billion passenger-kilometres)
Source: EC


