4.1 Gross investment spending in road infrastructure in selected countries, 2017 - 2020 (at current prices and exchange rates - million Euros)
| Country/Year | 2017 | 2018 | 2019 | 2020 |
| AT | 515 | 463 | 562 | 548 |
| BE | 656 | 681 | 735 | — |
| BG | 115 | 882 | 528 | 525 |
| HR | 197 | 285 | 355 | 442 |
| CZ | 984 | 1044 | 1383 | 1641 |
| DK | 1066 | 1084 | — | — |
| EE | 197 | 219 | 220 | 244 |
| FI | 1235 | 1526 | 1522 | 1444 |
| FR | 9080 | 9631 | 9833 | 9090 |
| DE | 13520 | 14870 | 15710 | 16050 |
| EL | 3895 | 2158 | 758 | 798 |
| HU | 1280 | 1780 | 2288 | 1820 |
| IE | 547 | 693 | 837 | — |
| IT | 3409 | 6555 | 4310 | — |
| LV | 226 | 221 | 223 | 198 |
| LT | 345 | 325 | 352 | 466 |
| LU | 226 | 188 | 260 | 246 |
| PL | 3210 | 2669 | 2415 | 3207 |
| RO | 2134 | 2182 | — | — |
| SK | 750 | 769 | — | 752 |
| SI | 217 | 330 | 306 | 235 |
| ES | 3690 | 3518 | 3445 | 3927 |
| SE | 2374 | 2497 | 2503 | 2942 |
| UK | 9083 | 8673 | 9642 | — |
| AL | 159 | 169 | 176 | 193 |
| MK | 195 | 148 | 232 | 165 |
| RS | 506 | 443 | 584 | — |
| IS | 91 | 99 | 91 | 107 |
| NO | 3718 | 4061 | 4051 | — |
| CH | 3930 | 3817 | 4301 | — |
Source: ITF, OECD
Note:
the data coverage varies significantly from a country to another, mainly due to the lack of more detailed common definitions and the difficulty for countries to change their data collection system.
Data extracted on 08 July 2022 from OECD.Stat
4.2 Investment in inland transport infrastructure in selected EU countries, 2020 (as a percentage of GDP, at current prices)
Source: ITF at the OECD
Data extracted on 08 Jul 2022 10:27 UTC (GMT) from OECD.Stat
No data for: NL, PT, CY, MT, SK
BE: 2019, DK: 2018, IE: 2019, IT: 2019, RO: 2018, UK: 2019
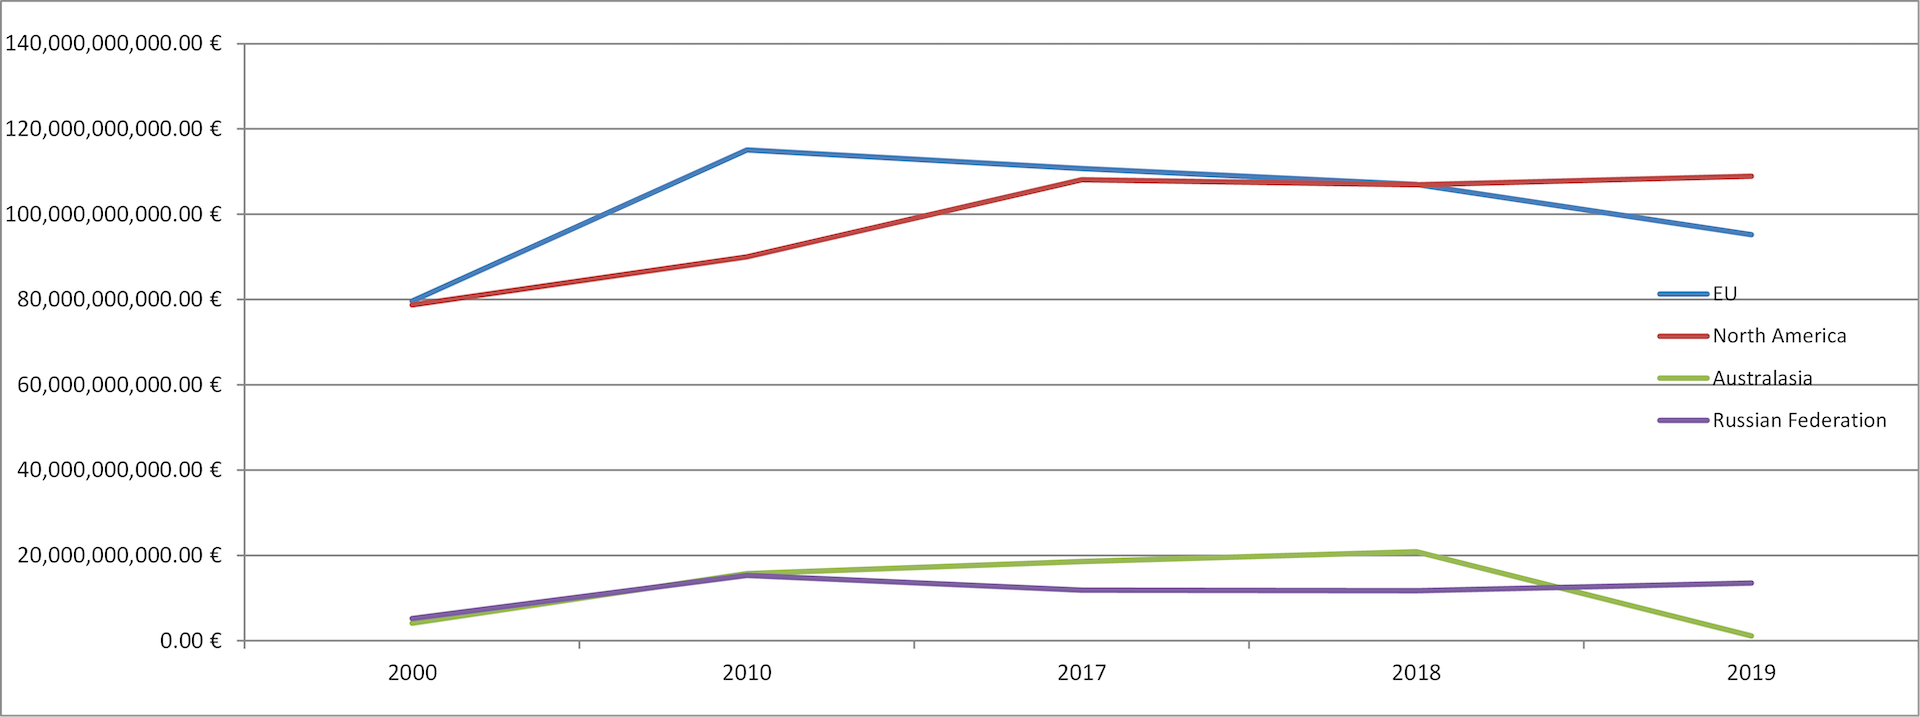
4.3 Volume of investment in inland transport infrastructure by region, 1997 - 2019 (Euro)
The drop in Australasia is due to non existing data for this region in 2019
Data extracted on 02 Jul 2021 09:01 UTC (GMT) from OECD.Stat
Source: ITF
4.4 Distribution of infrastructure investment between modes in EU 28, 2000-2020 (Euros, current prices, current exchange rates)
Note: For Road and Rail no data for CY
For IWI no data for CY, UK, IE
Source: ITF
4.5 Maintenance expenditures in road infrastructure in selected countries, 2017-2020 (at current prices and exchange rates - million Euros)
| GEO/TIME | 2017 | 2018 | 2019 | 2020 |
| AT | 687 | 726 | 752 | 791 |
| BE | 397 | 216 | 213 | — |
| BG | 164 | 257 | 213 | 525 |
| HR | 172 | 193 | 257 | 239 |
| CZ | 721 | 871 | 982 | 884 |
| DK | 1.118 | 1.151 | — | — |
| EE | 42 | 39 | 43 | 43 |
| FI | 549 | 543 | 494 | 674 |
| FR | 2.369 | 2.371 | 2.327 | 2.194 |
| HU | 369 | 380 | 376 | 387 |
| IE | 81 | 88 | 75 | — |
| IT | 8.803 | 7.352 | 6.813 | — |
| LV | 179 | 202 | 180 | 259 |
| LT | 151 | 144 | 147 | 140 |
| LU | 54 | 67 | 40 | 39 |
| PL | 517 | 465 | 481 | 504 |
| SK | 230 | 296 | — | — |
| SI | 117 | 115 | 122 | 139 |
| SE | 1.035 | 1.033 | 1.000 | 1.028 |
| UK | 2.018 | 2.331 | 2.312 | — |
| Total EU | 19.773 | 18.840 | 16.826 | 7.845 |
| AL | 14 | 13 | 13 | 9 |
| RS | 203 | 298 | 343 | — |
| TR | 229 | — | — | — |
| IS | 68 | 83 | 71 | 68 |
| CH | 2.709 | 2.593 | 2.338 | — |
Source: ITF
Notes: No data for NL, PT and RO
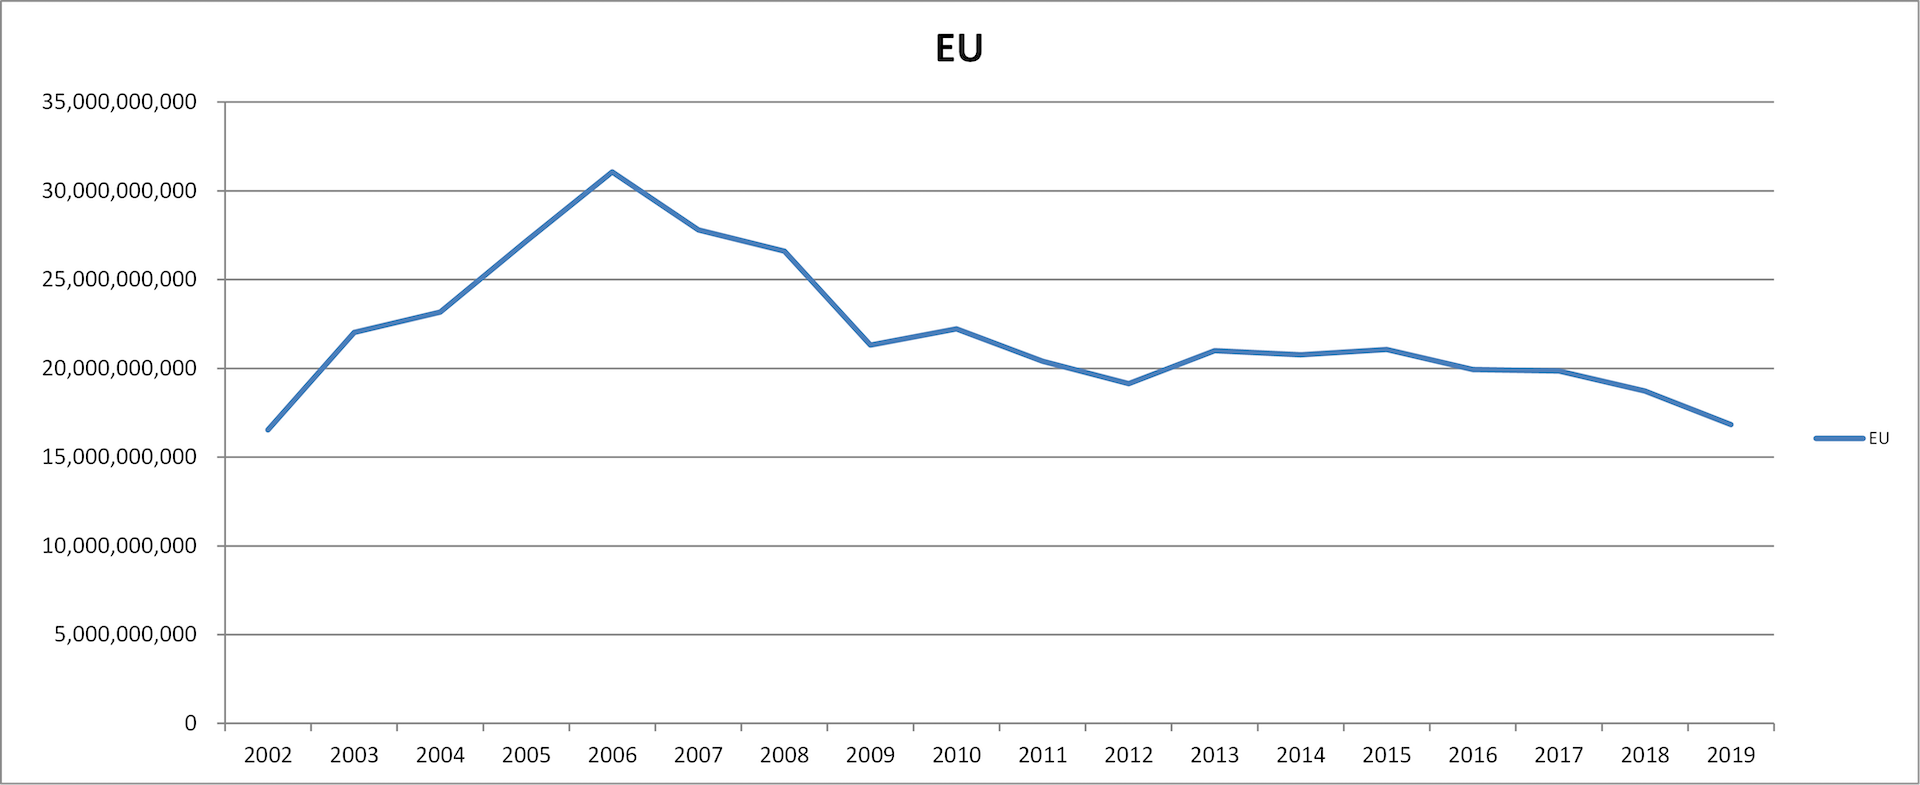
4.6 Maintenance expenditures in road infrastructure in selected countries, 2002 - 2019 (million Euros)
Source: ITF
Note: No data for CY
Drop in the curb is explained by the fact that for 2019 no data for NL, PT, RO, DK and SI


