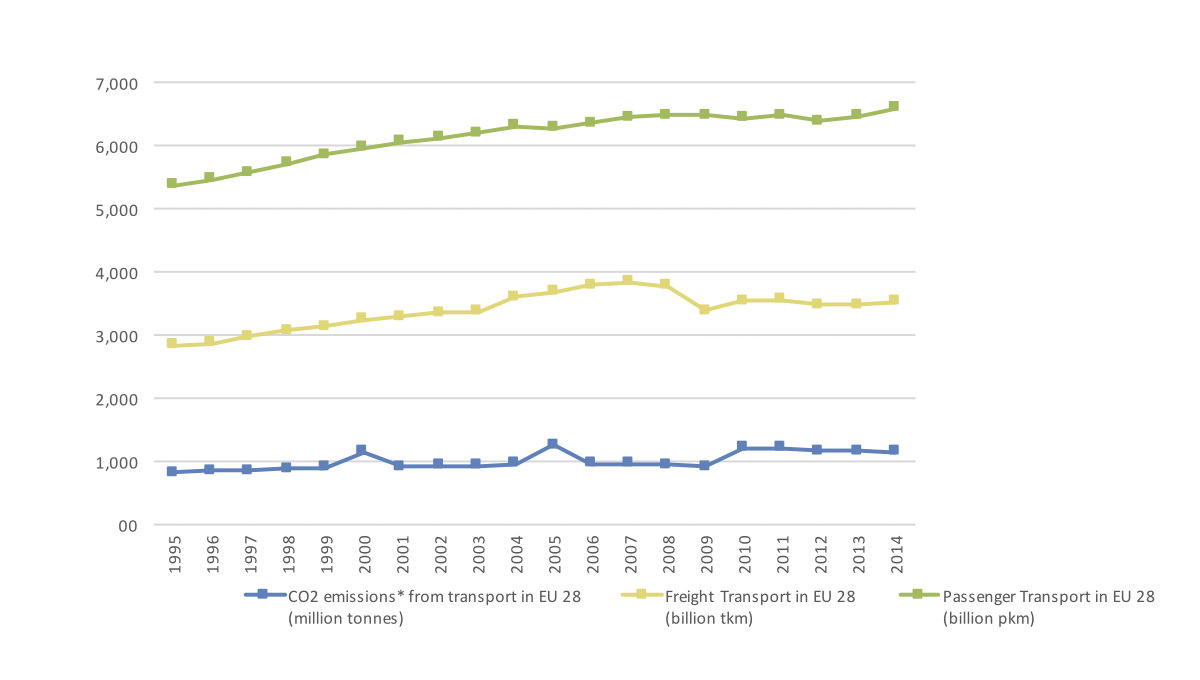
9.1 Comparison between freight & passenger transport evolution and CO2 emissions in EU 28, 1995-2014
Source: EC
* Including International Bunkers (international traffic departing from the EU)
Emissions for 00,05,2010,2011,2012 EU-28
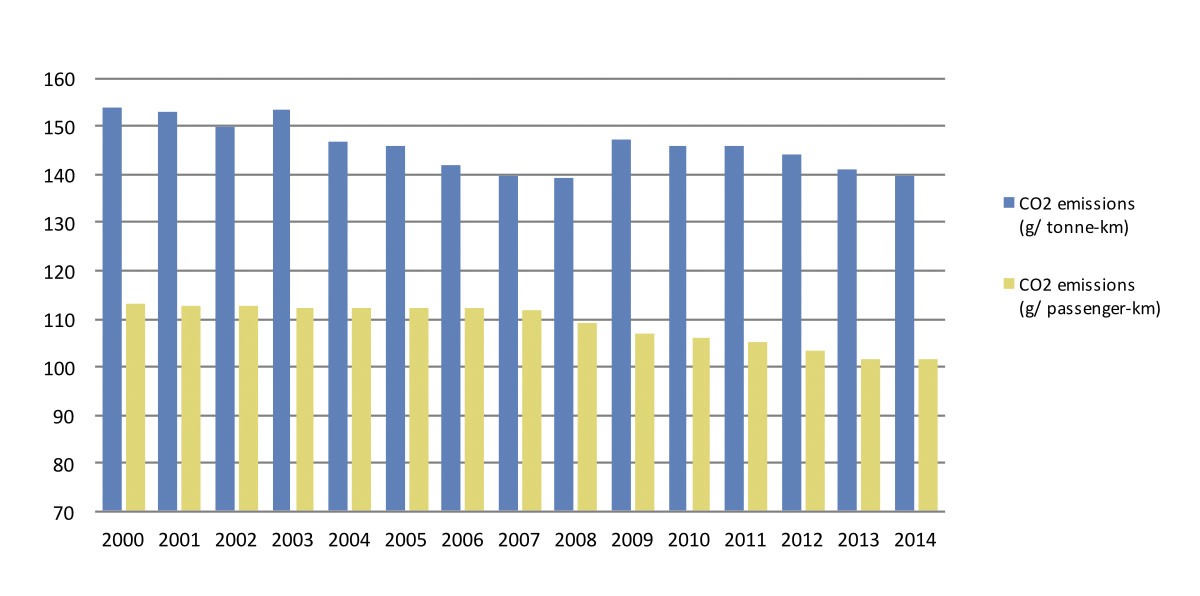
9.2 CO2 emissions from road transport in EU and selected countries, 2000-2014 (g/ tonne-km & g/ passenger-km)
Source: EEA
(*) EU 28 plus Norway, Switzerland and Turkey
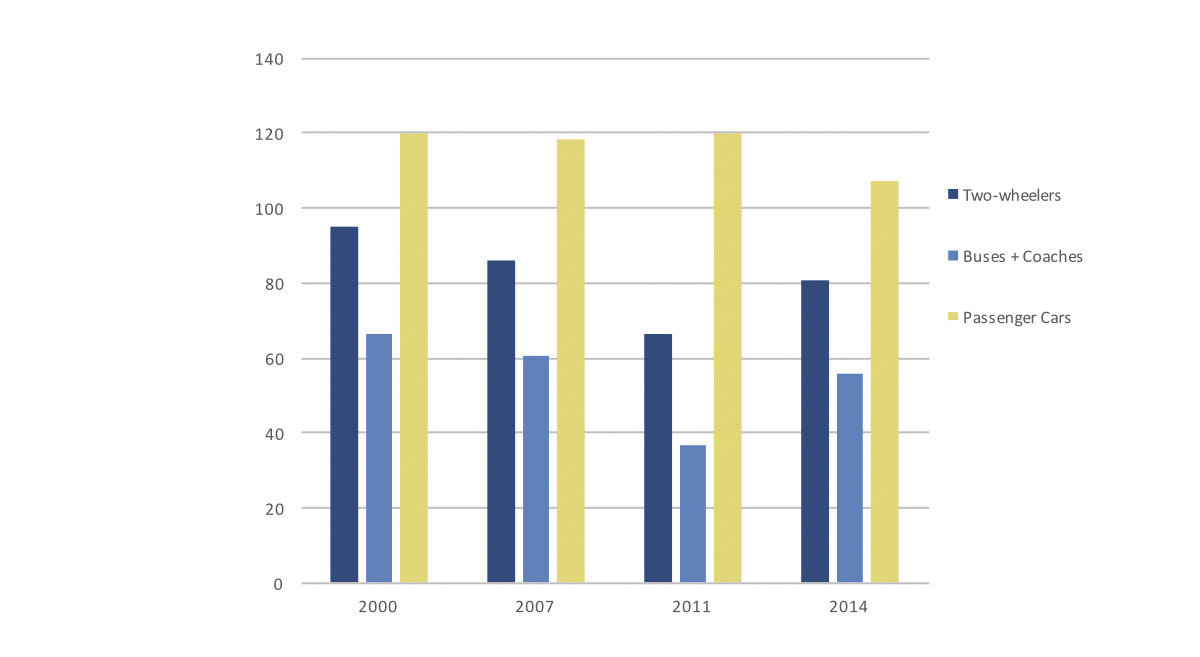
9.3 CO2 emissions from road passenger transport by mode in EU and selected countries (g/pkm)
Source: EEA
(*) EU-28 plus Norway, Switzerland and Turkey
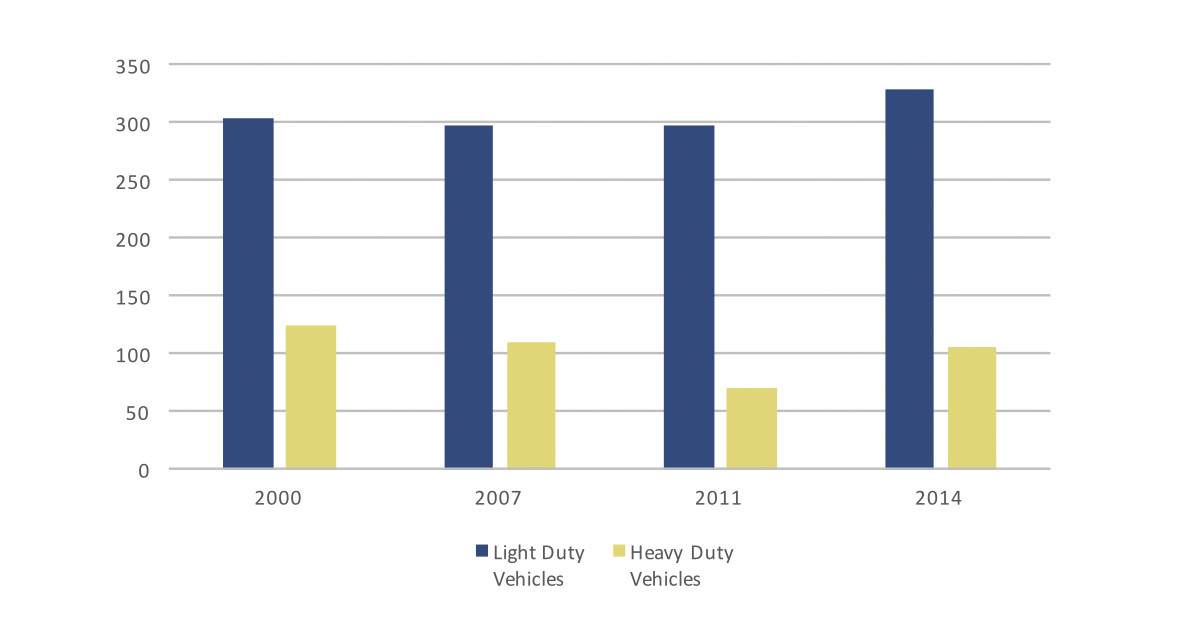
9.4 CO2 emissions from road freight transport in EU and selected countries (g/tkm)
Source: EEA
(*) EU-28 plus Norway, Switzerland and Turkey
9.5 Biofuels share in transport consumption in EU, 1996-2015 (%)
Source: Eurostat
9.6 Share of total CO2 emmissions from fossil fuel by sector in EU (Mt CO2), 2016
* Includes public power and heat production
** Excludes emissions from non-energy use and feedstock use of fuels
*** Excludes international marine and aviation bunkers
**** Service sector; includes agriculture and forestry
Source: JRC – EDGAR


