3.1 Toll net revenues in selected countries, 2010-2015 (EUR million)
| 2010 | 2011 | 2012 | 2013 | 2014 | 2015 | ||
|---|---|---|---|---|---|---|---|
| DK | 454,0 | 472.00 | 492,0 | 507,0 | 537,0 | 559,0 | DK |
| EL | 565,0 | 530.00 | 516,0 | 516,0 | 469,0 | 495,0 | EL |
| ES | 1820,6 | 1,808.7 | 1623,8 | 1565,0 | 1608,6 | 1709,3 | ES |
| FR | 7775,6 | 8,442.6 | 8450,0 | 9170 (1) | 9222,4 | 9160,0 | FR |
| IE | 184,0 | 184.00 | 193,0 | 200,0 | 217,0 | 217,0 | IE |
| IT | 4835,9 | 4,971.00 | 4804,5 | 4914,0 | 5176,9 | 5454,9 | IT |
| NL | 27.21 | 28.49 | 26,8 | 26,5 | 27,7 | 28,3 | NL |
| AT | 1,535.50 | 1,561.00 | 1622,1 | 1687,0 | 1826,0 | 1840,0 | AT |
| PT | 725.31 | 693.43 | 627,8 | 812,5 | 855,4 | 915,6 | PT |
| HU | 145.50 | 167.90 | 167,9 | 189,2 | 677,6 | 677,6 | HU |
| SI | 290.10 | 298.34 | 294,9 | 305,0 | 344,2 | 349,9 | SI |
| NO | 457.30 | 605.70 | 641,2 | 614,4 | 940,6 | 940,6 | NO |
| HR | 267.40 | 272.34 | 282,8 | 296,69 (2) | 297,1 | 317,3 | HR |
| PL | 189.3 | 148.25 | 157,0 | 179,6 (3) | 185,9 | 209,0 | PL |
| UK | 70.1 | 64.40 | 71,6 | 77,6 | 83,3 | 102,0 | UK |
| RS | 137.9 | 137.90 | 19,0 | 138,3 | 138,4 | 139,6 | RS |
| CZ | 262.8 | 325.00 | 346,5 | 342,2 (4) | 316,0 | 360,2 | CZ |
| DE | 4,484.00 | 4,498.00 | 4364,0 | 4400,0 | 4460,0 | 4370,0 | DE |
| RF | – | – | – | 29,3 | 75,2 | 55,5 | RF |
| SK | 175.3 | 199.88 | 151,3 | 158,63 (5) | 113,7 | 119,6 | SK |
Source: ASECAP
Notes:
(1) Provisional figure
(2) Preliminary value for 2013
(3) Toll revenues on motorways A2 and A4
(4) km-based tolling only
(5) Revenue from ETC and the revenue from the vignette on the whole charged network including motorways, expressways and selected 1st class roads
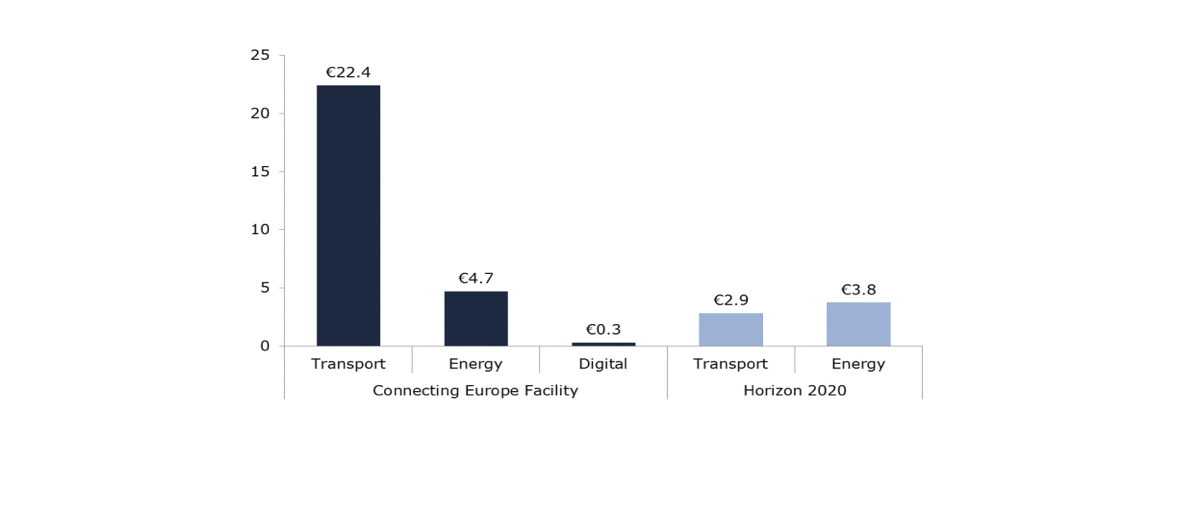
3.2 Budget managed by INEA (Total 34.0 bn)
Source: EC
3.3 European Investment Bank Loans for Transport to EU 28, 2006-2015 (EUR million)
| 2006 | 2007 | 2.008 | 2009 | 2010 | 2011 | 2012 | 2013 | 2014 | 2015 | |
|---|---|---|---|---|---|---|---|---|---|---|
| Roads, Motorways | 4.384 | 3.542 | 4.932 | 6.030 | 3716 | 3876 | 2726 | 4728 | 5384 | 2827 |
| Railways | 2.999 | 3.534 | 2.495 | 2.704 | 4352 | 4624 | 3541 | 3419 | 3875 | 5548 |
| Urban Transport | 1.294 | 1.924 | 1.981 | 3.399 | 4151 | 4411 | 2655 | 2733 | 2865 | 3371 |
| Air Transport | 764 | 644 | 2.458 | 1.740 | 487 | 500 | 261 | 420 | 428 | 18 |
| Maritime Transport | 593 | 454 | 894 | 1.821 | 496 | 793 | 863 | 212 | 368 | 586 |
| Intermodal Freight Terminals and Other | 36 | 29 | 763 | n.a. | 2 | 66 | 28 | 81 | 45 | 15 |
| Transport | 60 | |||||||||
| Total Transport Sector | 10.070 | 10.127 | 13.523 | 15.694 | 13.204 | 14.270 | 10.074 | 11.593 | 12.965 | 12.425 |
Source: EIB
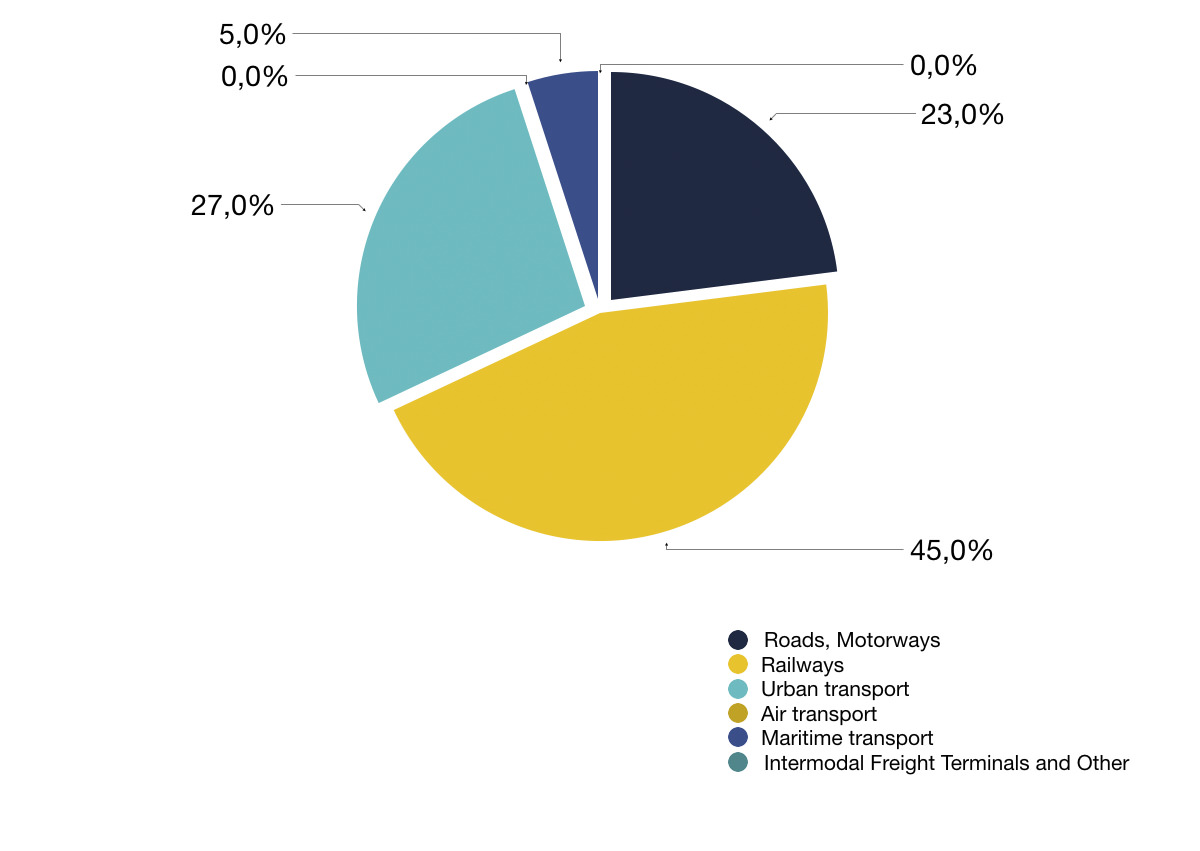
3.4 European Investment Bank Loans for Transport to EU 28, 2015 (total € 12,425 million)
Source: EIB
3.5 World Bank Total Transport Lending, 2004-2016 ($ million)
Source: World Bank
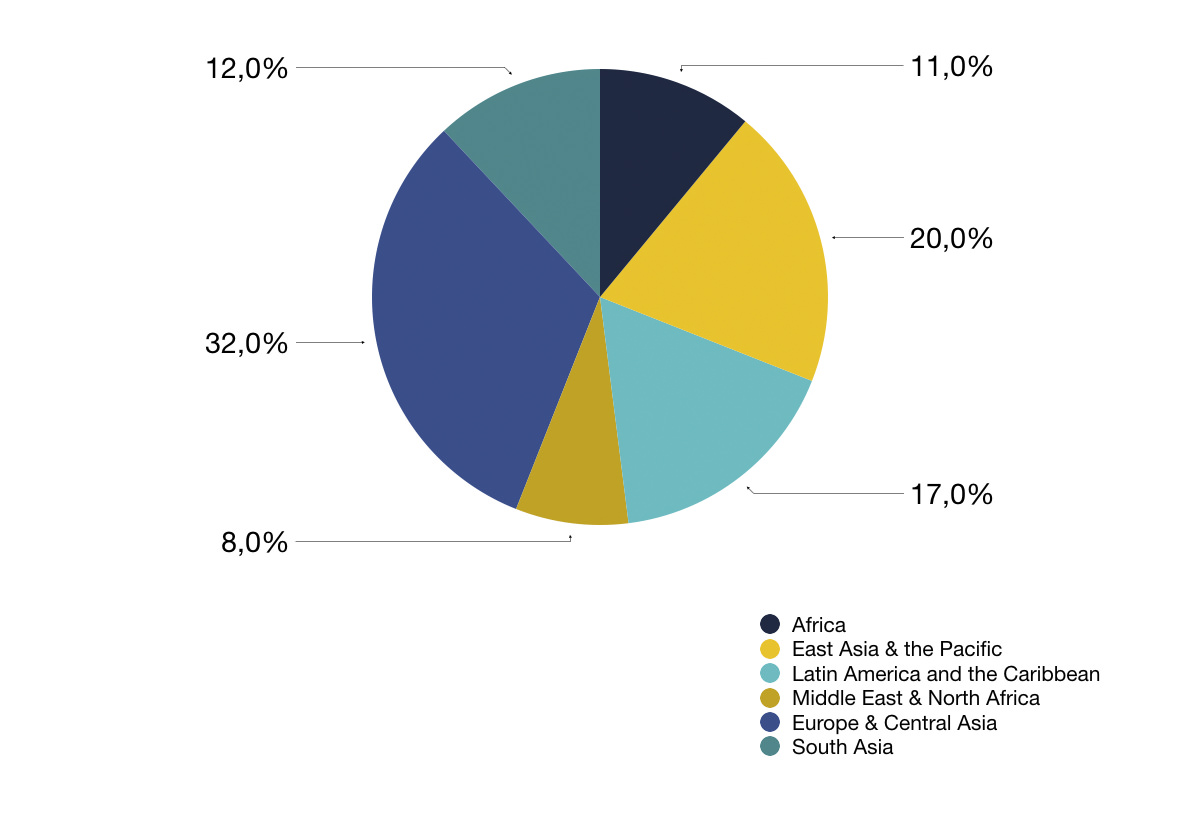
3.6 Transport Lending Breakdown by Region, 2016 (total $ 6.39 billion)
Source: World Bank


