6.1 Transport of passengers by mode in EU 28, 1995-2014 (billion pkm)
| Passenger Cars | P2W | Bus & Coach | Rail -way | Tram & Metro | Air | Sea | Total | |
|---|---|---|---|---|---|---|---|---|
| 1995 | 3 935 | 116 | 503 | 350 | 74 | 348 | 44 | 5 370 |
| 1996 | 4 003 | 118 | 507 | 349 | 75 | 368 | 44 | 5 464 |
| 1997 | 4 087 | 122 | 509 | 350 | 76 | 392 | 44 | 5 579 |
| 1998 | 4 191 | 126 | 516 | 351 | 77 | 411 | 43 | 5 715 |
| 1999 | 4 307 | 130 | 518 | 358 | 79 | 427 | 43 | 5 862 |
| 2000 | 4 355 | 108 | 549 | 372 | 81 | 460 | 42 | 5 965 |
| 2001 | 4 454 | 112 | 549 | 374 | 82 | 455 | 42 | 6 068 |
| 2002 | 4 542 | 114 | 539 | 366 | 82 | 447 | 43 | 6 135 |
| 2003 | 4 586 | 117 | 543 | 362 | 83 | 466 | 43 | 6 200 |
| 2004 | 4 652 | 121 | 545 | 369 | 86 | 496 | 43 | 6 310 |
| 2005 | 4 591 | 123 | 542 | 377 | 87 | 530 | 42 | 6 293 |
| 2006 | 4 636 | 123 | 538 | 389 | 89 | 552 | 42 | 6 370 |
| 2007 | 4 690 | 119 | 551 | 396 | 91 | 575 | 43 | 6 466 |
| 2008 | 4 698 | 124 | 557 | 411 | 94 | 560 | 43 | 6 488 |
| 2009 | 4 774 | 122 | 535 | 404 | 94 | 522 | 43 | 6 493 |
| 2010 | 4 726 | 123 | 529 | 405 | 97 | 538 | 40 | 6 458 |
| 2011 | 4 702 | 125 | 531 | 415 | 98 | 579 | 39 | 6 489 |
| 2012 | 4 621 | 126 | 525 | 420 | 100 | 572 | 42 | 6 405 |
| 2013 | 4 678 | 125 | 528 | 425 | 100 | 579 | 39 | 6 475 |
| 2014 | 4 766 | 127 | 526 | 428 | 102 | 605 | 38 | 6 592 |
| 1995 -2014 | 21,1% | 9,4% | 4,5% | 22,2% | 37,8% | 74,0% | -15,5% | 22,7% |
| per year | 1,1% | 0,5% | 0,2% | 1,1% | 1,8% | 3,1% | -0,9% | 1,1% |
| 2000-2014 | 9,4% | 18,2% | -4,2% | 15,3% | 25,6% | 31,7% | -10,1% | 10,5% |
| per year | 0,6% | 1,2% | -0,3% | 1,0% | 1,6% | 2,0% | -0,8% | 0,7% |
| 2013-2014 | 1,9% | 1,8% | -0,5% | 0,8% | 1,6% | 4,5% | -3,9% | 1,8% |
Source: EC
Notes:
In italics: Estimates
Air and Sea: only domestic and intra-EU-28 transport; provisional estimates
P2W: Powered two-wheelers
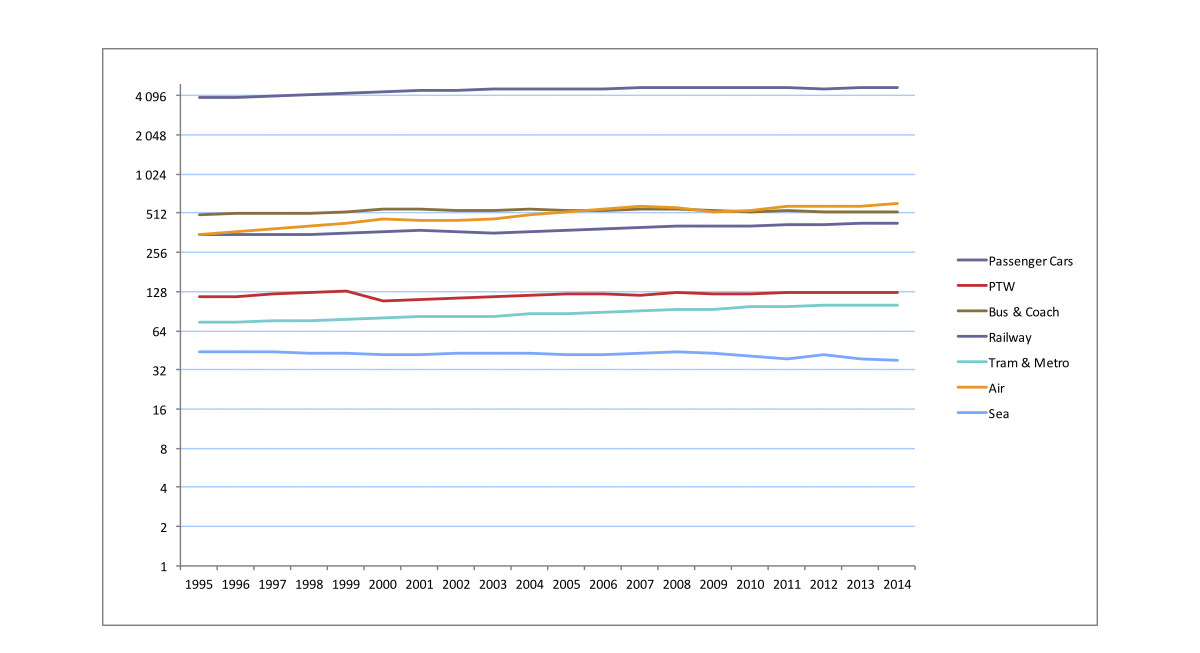
6.2 Evolution of passenger transport by mode in EU 28, 1995-2014
Source: EC
Notes:
Air and Sea: only domestic and intra-EU-28 transport; provisional estimates
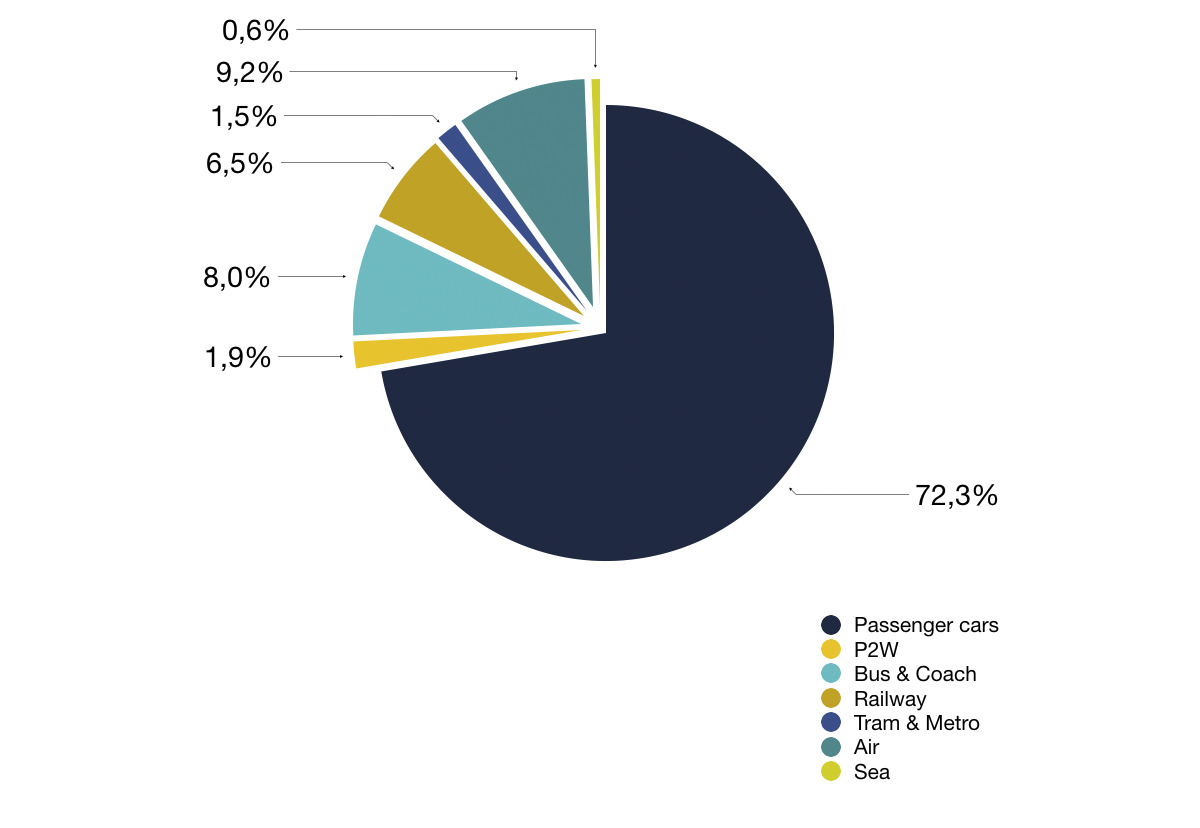
6.3 Passenger transport modal split in EU 28, 2014 (pkm in %)
Source: EC
Notes:
Air and Sea: only domestic and intra-EU-28 transport; provisional estimates Air and Sea: only domestic and intra-EU-28 transport; provisional estimates
P2W: Powered two-wheelers
6.4 Passenger vehicles in EU countries, 2014
| “Stock of registered | |||
|---|---|---|---|
| passenger cars | |||
| (thousand)” | “Stock of registered | ||
| PTW | |||
| (thousand)” | Stock of registered buses & coaches (thousand) | ||
| BE | 5572,57 | 453,01 | 16,77 |
| BG | 3013,90 | 154,80 | 23,60 |
| CZ | 4833,39 | 998,82 | 20,51 |
| DK | 2329,58 | 197,51 | 13,41 |
| DE | 44403,12 | 6181,74 | 77,50 |
| EE | 653,00 | 42,30 | 4,60 |
| IE | 1966,24 | 36,57 | 8,80 |
| EL | 5107,62 | 1619,62 | 26,59 |
| ES | 22029,51 | 5033,21 | 59,80 |
| FR | 31800,00 | 3015,22 | 89,00 |
| HR | 1474,50 | 153,05 | 5,04 |
| IT | 37080,75 | 9022,23 | 97,91 |
| CY | 478,49 | 40,97 | 2,58 |
| LV | 657,80 | 46,42 | 4,85 |
| LT | 1205,67 | 33,16 | 6,94 |
| LU | 372,83 | 27,28 | 1,78 |
| HU | 3107,70 | 161,54 | 17,92 |
| MT | 265,95 | 18,40 | 1,79 |
| NL | 7979,08 | 1772,21 | 9,60 |
| AT | 4694,92 | 788,18 | 9,59 |
| PL | 20003,86 | 2406,11 | 106,06 |
| PT | 4496,00 | 486,00 | 14,50 |
| RO | 4907,56 | 107,34 | 44,28 |
| SI | 1068,36 | 95,80 | 2,56 |
| SK | 1949,06 | 80,79 | 9,16 |
| FI | 3179,80 | 568,19 | 16,25 |
| SE | 4584,71 | 618,55 | 13,99 |
| UK | 30557,16 | 1240,20 | 112,16 |
| EU 28 | 249773,13 | 35399,24 | 817,53 |
| MK | 371,45 | 8,63 | 3,16 |
| RS | 1797,43 | 63,17 | 9,04 |
| TR | 9857,92 | 2828,47 | 638,46 |
Source: EC
Notes:
In italics: Estimates
Motorisation: Passenger car stock at end of year n has been divided by the population on 1 January of year n+1
Stock of registered passenger cars, PTWs and buses and coaches: At end of year, except for BE (1 August).
Stock of registered passenger cars: Taxis are usually included.
Stock of registered buses and coaches: Data include buses, coaches, minibuses and sometimes also trolleybuses.
Stock of registered PTW: National vehicle stock data do not always include all powered two-wheelers and are therefore not fully comparable between countries. Break in time series due to inclusion of mopeds from 2001 in ES, from 2002 in SI and HR, from 2004 in LV, from 2005 in PL, from 2007 in LT.
Tricycles and quads are sometimes included in the data.
6.5 Motorcycle registrations in EU countries, 2010-2016
| 2010 | 2011 | 2012 | 2013 | 2014 | 2015 | 2016 | |
|---|---|---|---|---|---|---|---|
| AT | 21.510 | 22.750 | 24.808 | 25.996 | 25.155 | 24.891 | 29.763 |
| BE | 24.271 | 25.047 | 23.428 | 20.644 | 20.681 | 21.577 | 23.621 |
| BG | na | na | 127 | 173 | n.a. | NA | NA |
| CY | 3.060 | 2.527 | 2.074 | 1.675 | n,a | NA | NA |
| CZ | 5.418 | 6.056 | 6.974 | na | 12.441 | 13.424 | 14.086 |
| DE | 122.382 | 126.991 | 127.497 | 129.605 | 141.623 | 151.661 | 174.624 |
| DK | 3.258 | 2.032 | 1.984 | 1.870 | 1.936 | 2.417 | 3.139 |
| EE | 244 | 299 | 364 | 409 | 449 | 489 | 609 |
| EL | 59.638 | 44.785 | 31.805 | 28.522 | 30.951 | 32.468 | 38.632 |
| ES | 134.297 | 119.423 | 97.931 | 92.678 | 111.460 | 132.536 | 155.003 |
| FI | 6.054 | 5.692 | 4.986 | 3.943 | 3.467 | 3.157 | 3.022 |
| FR | 198.086 | 185.122 | 169.644 | 147.915 | 153.324 | 153.242 | 163.335 |
| HR | 2.851 | 2.726 | 2.397 | 2.046 | na | 1.511 | 1.811 |
| HU | 2.453 | 2.091 | 1.957 | 1.778 | na | 2.093 | 2.204 |
| IE | 1.042 | 831 | 663 | 441 | 360 | 1.022 | 1.420 |
| IT | 306.303 | 254.895 | 206.291 | 153.941 | 156.431 | 172.073 | 195.290 |
| LT | 229 | 280 | 224 | 241 | 294 | 294 | 390 |
| LU | 1.255 | 1.306 | 1.201 | 1.566 | 1.734 | 1.654 | 1.783 |
| LV | 278 | 472 | 494 | 477 | 589 | 595 | 642 |
| MT | 568 | 746 | na | na | na | NA | NA |
| NL | 12.843 | 11.662 | 10.617 | 9.570 | 10.673 | 11.688 | 12.872 |
| PL | 8.718 | 8.957 | 7.758 | 7.394 | 9.848 | 23.865 | 25.823 |
| PT | 18.896 | 18.937 | 17.136 | 14.510 | 15.335 | 17.611 | 19.760 |
| RO | 440 | 469 | 555 | 521 | na | 648 | 952 |
| SE | 9.024 | 8.223 | 7.605 | 7.800 | 8.378 | 9.422 | 13.220 |
| SK | 2.324 | 1.960 | 1.920 | 2.840 | na | 5.309 | 5.565 |
| SI | 2.658 | 2.139 | 2.042 | 2.380 | 1.707 | 1.855 | 2.074 |
| UK | 81.060 | 79.144 | 80.029 | 80.951 | 91.492 | 105.717 | 119.889 |
| EU 28 | 1.029.160 | 935.562 | 832.511 | 739.886 | 798.328 | 891.219 | 1.009.529 |
Source: ACEM
Notes:
Data of 2015 available till November


