7.1 Road accidents involving personal injury by country, 1990-2015 (thousand)
| 1990 | 1995 | 2000 | 2005 | 2010 | 2015 | Evolution 1990-2015 (%) | |
|---|---|---|---|---|---|---|---|
| BE | 62,4 | 50,7 | 49,1 | 49,3 | 42,1 | 40,3 | -45,1 |
| BG | 6,5 | 7,4 | 6,9 | 8,2 | 6,6 | 7,2 | 10,8 |
| CZ | 21,9 | 28,8 | 25,4 | 25,2 | 19,7 | 21,6 | -1,4 |
| DK | 9,2 | 8,4 | 7,3 | 5,4 | 3,5 | 2,9 | -85,8 |
| DE | 389,4 | 388,0 | 382,9 | 336,6 | 288,3 | 305,7 | -21,9 |
| EE | 2,1 | 1,6 | 1,5 | 2,3 | 1,3 | 1,4 | -47,1 |
| IE | 6,1 | 8,1 | 7,7 | 6,5 | 5,8 | 5,5 | -7,8 |
| EL | 19,6 | 22,8 | 23,0 | 16,9 | 15,0 | 11,6 | -35,0 |
| ES | 101,5 | 83,6 | 101,7 | 91,2 | 85,5 | 97,8 | -3,7 |
| FR | 162,6 | 133,0 | 121,2 | 84,5 | 67,3 | 56,6 | -87,4 |
| HR | 14,5 | 12,7 | 14,4 | 15,7 | 13,3 | 11,0 | -23,8 |
| IT | 161,8 | 182,8 | 256,5 | 240,0 | 211,4 | 174,5 | 5,0 |
| CY | 3,2 | 3,1 | 2,4 | 1,4 | 1,2 | 0,7 | -104,2 |
| LV | 4,3 | 4,1 | 4,5 | 9,3 | 3,2 | 3,7 | -14,1 |
| LT | 5,1 | 4,1 | 5,8 | 6,8 | 3,5 | 3,2 | -33,8 |
| LU | 1,2 | 1,2 | 0,9 | 0,8 | 0,8 | 1,0 | -25,9 |
| HU | 27,8 | 19,8 | 17,5 | 20,8 | 16,3 | 16,3 | -65,6 |
| MT | 0,2 | 1,0 | 1,3 | 0,8 | 0,6 | 1,4 | 91,2 |
| NL | 44,9 | 42,6 | 42,3 | 27,0 | 12,5 | 18,5 | -62,4 |
| AT | 46,3 | 39,0 | 42,1 | 40,9 | 35,3 | 38,0 | -19,9 |
| PL | 50,5 | 56,9 | 57,3 | 48,1 | 38,8 | 33,0 | -30,6 |
| PT | 45,1 | 48,3 | 44,5 | 37,1 | 35,4 | 32,0 | -29,6 |
| RO | 9,7 | 9,1 | 7,9 | 19,8 | 26,0 | 28,9 | 243,8 |
| SI | 5,2 | 6,6 | 9,0 | 10,5 | 7,7 | 6,6 | 15,7 |
| SK | 8,2 | 8,7 | 7,9 | 7,9 | 8,1 | 5,2 | -38,9 |
| FI | 10,2 | 7,8 | 6,6 | 7,0 | 6,1 | 5,2 | -75,5 |
| SE | 17,0 | 15,6 | 15,8 | 18,1 | 16,5 | 14,7 | -14,6 |
| UK | 265,6 | 237,3 | 242,1 | 203,7 | 160,1 | 146,2 | -49,3 |
| EU 28 | 1502,1 | 1433,0 | 1505,7 | 1342,0 | 1130,4 | 1090,3 | -27,3 |
| ME | 9,1 | n.a. | n.a. | ||||
| MK | 2,3 | 2,4 | 1,7 | 2,8 | 4,2 | n.a. | n.a. |
| IS | 0,6 | 1,1 | 1,0 | 0,7 | 0,9 | n.a. | n.a. |
| NO | 8,8 | 8,6 | 8,4 | 8,1 | 6,4 | n.a. | n.a. |
| CH | 23,8 | 23,0 | 23,7 | 21,7 | 19,6 | n.a. | n.a. |
Source: CARE; United Nations (Statistics of road traffic accidents), national statistics (MT, candidate countries, IS, CH).
Notes: the definition of an accident involving personal injury differs from country to country. RO: only serious accidents before 2005.
ME : Data used from 2010 and onwards
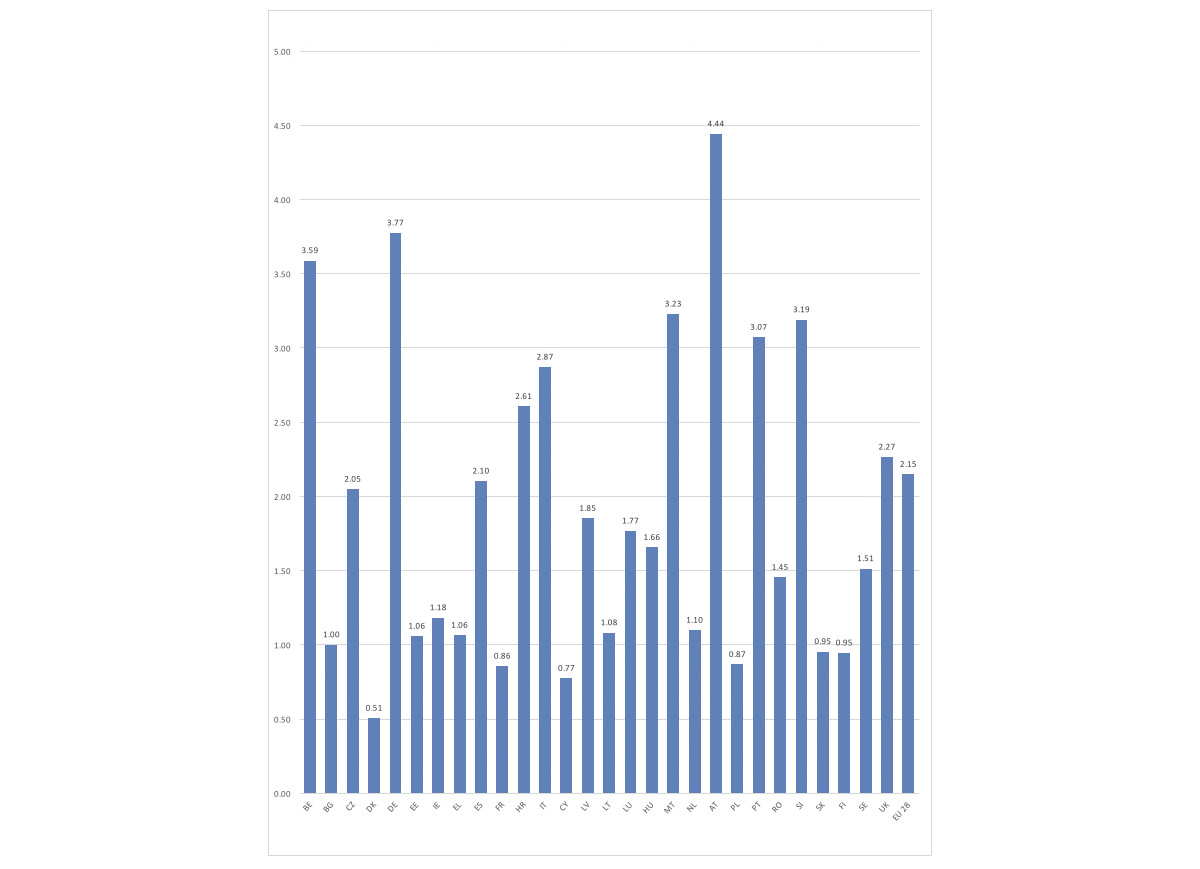
7.2 Road accidents involving personal injury per one thousand population in EU countries, 2015
Source: EC
Notes:
The definition of an accident involving personal injury differs from country to country.
The number of inhabitants used in this table is the sum of the population at 1 January 2014 and at 1 January 2015 divided by two.
7.3 Road fatalities in EU countries, 2005-2015
| 2005 | 2010 | 2011 | 2012 | 2013 | 2014 | 2015 | evolution 14/15 | evolution 05/15 | |
|---|---|---|---|---|---|---|---|---|---|
| BE | 1 089 | 840 | 862 | 770 | 723 | 727 | 732 | 0,7 | -32,8 |
| BG | 957 | 776 | 657 | 601 | 601 | 661 | 708 | 7,1 | -26,0 |
| CZ | 1 286 | 802 | 772 | 742 | 655 | 688 | 734 | 6,7 | -42,9 |
| DK | 331 | 255 | 220 | 167 | 191 | 182 | 178 | -2,2 | -46,2 |
| DE | 5 361 | 3 648 | 4 009 | 3 600 | 3 339 | 3 377 | 3 459 | 2,4 | -35,5 |
| EE | 170 | 79 | 101 | 87 | 81 | 78 | 67 | -14,1 | -60,6 |
| IE | 400 | 212 | 186 | 162 | 188 | 193 | 166 | -14,0 | -58,5 |
| EL | 1 658 | 1 258 | 1 141 | 988 | 879 | 795 | 805 | 1,3 | -51,4 |
| ES | 4 442 | 2 479 | 2 060 | 1 903 | 1 680 | 1 688 | 1 689 | 0,1 | -62,0 |
| FR | 5 318 | 3 992 | 3 963 | 3 653 | 3 268 | 3 384 | 3 461 | 2,3 | -34,9 |
| HR | 597 | 426 | 418 | 390 | 368 | 308 | 348 | 13,0 | -41,7 |
| IT | 5 818 | 4 114 | 3 860 | 3 753 | 3 401 | 3 381 | 3 428 | 1,4 | -41,1 |
| CY | 102 | 60 | 71 | 51 | 44 | 45 | 57 | 26,7 | -44,1 |
| LV | 442 | 218 | 179 | 177 | 179 | 212 | 188 | -11,3 | -57,5 |
| LT | 773 | 299 | 296 | 302 | 256 | 267 | 242 | -9,4 | -68,7 |
| LU | 47 | 32 | 33 | 34 | 45 | 35 | 36 | 2,9 | -23,4 |
| HU | 1 278 | 740 | 638 | 606 | 591 | 626 | 644 | 2,9 | -49,6 |
| MT | 17 | 13 | 16 | 9 | 17 | 10 | 11 | 10,0 | -35,3 |
| NL | 750 | 537 | 546 | 562 | 476 | 477 | 531 | 11,3 | -29,2 |
| AT | 768 | 552 | 523 | 531 | 455 | 430 | 479 | 11,4 | -37,6 |
| PL | 5 444 | 3 908 | 4 189 | 3 571 | 3 357 | 3 202 | 2 938 | -8,2 | -46,0 |
| PT | 1 247 | 937 | 891 | 718 | 637 | 638 | 593 | -7,1 | -52,4 |
| RO | 2 629 | 2 377 | 2 018 | 2 042 | 1 861 | 1 818 | 1 893 | 4,1 | -28,0 |
| SI | 258 | 138 | 141 | 130 | 125 | 108 | 120 | 11,1 | -53,5 |
| SK | 606 | 353 | 328 | 352 | 251 | 291 | 274 | -5,8 | -54,8 |
| FI | 379 | 272 | 292 | 255 | 258 | 229 | 266 | 16,2 | -29,8 |
| SE | 440 | 266 | 319 | 285 | 260 | 270 | 259 | -4,1 | -41,1 |
| UK | 3 336 | 1 905 | 1 960 | 1 802 | 1 770 | 1 854 | 1 806 | -2,6 | -45,9 |
| EU-28 | 45 943 | 31 488 | 30 689 | 28 243 | 25 956 | 25 974 | 26 112 | 0,5 | -43,2 |
Source: From 1991: CARE database (DG Mobility and Transport), International Transport Forum, national sources. 1990: IRTAD (OECD)
Notes: Persons killed are all persons deceased within 30 days of the accident. Corrective factors have been applied to the figures which did not follow this definition.
7.6 Lives saved per million inhabitants in EU countries in 2015 (compared to 2001)
Source: CARE
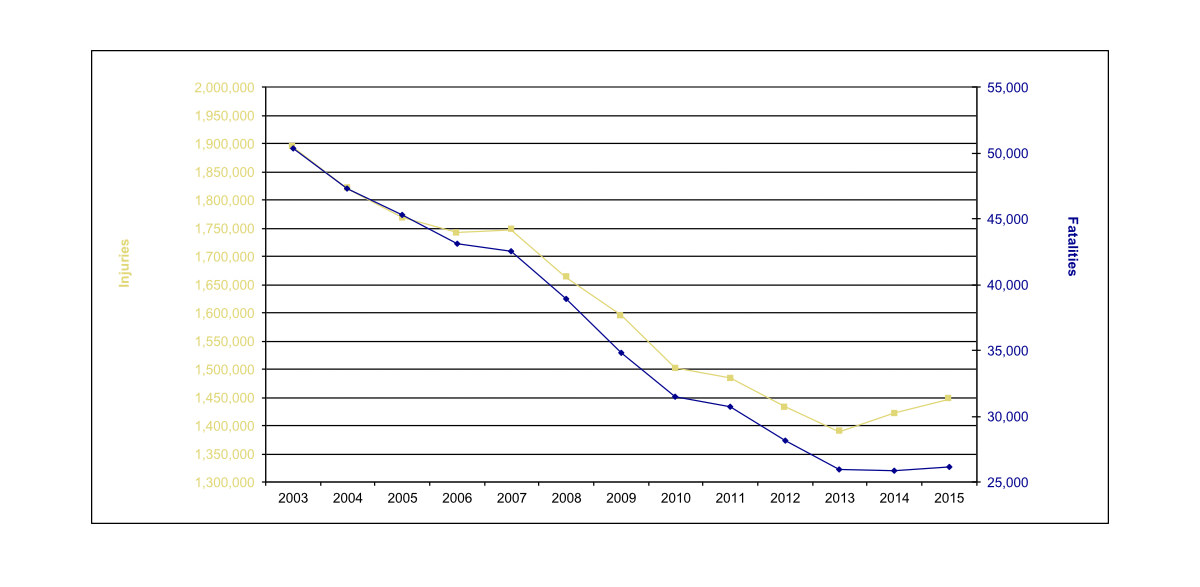
7.7 Evolution of road fatalities and injured in EU 28, 2003-2015
Source: CARE
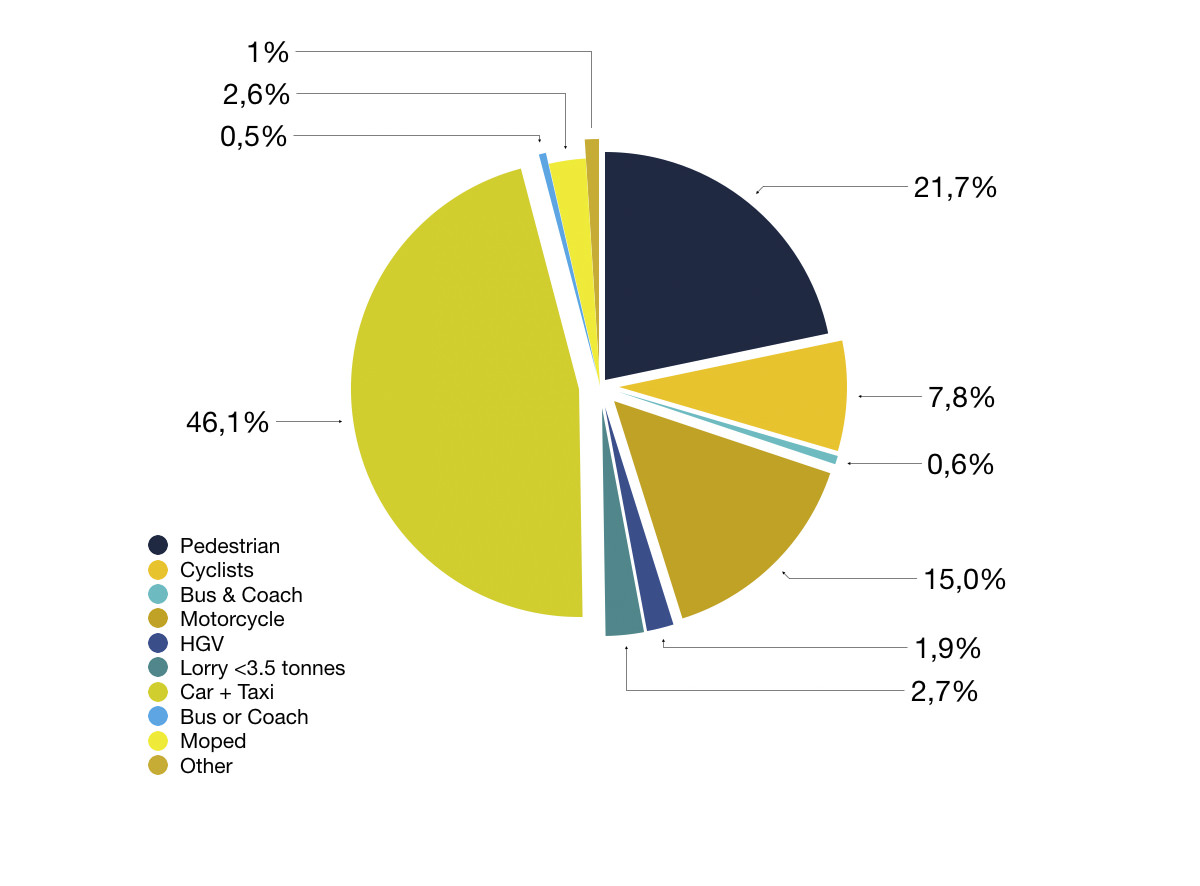
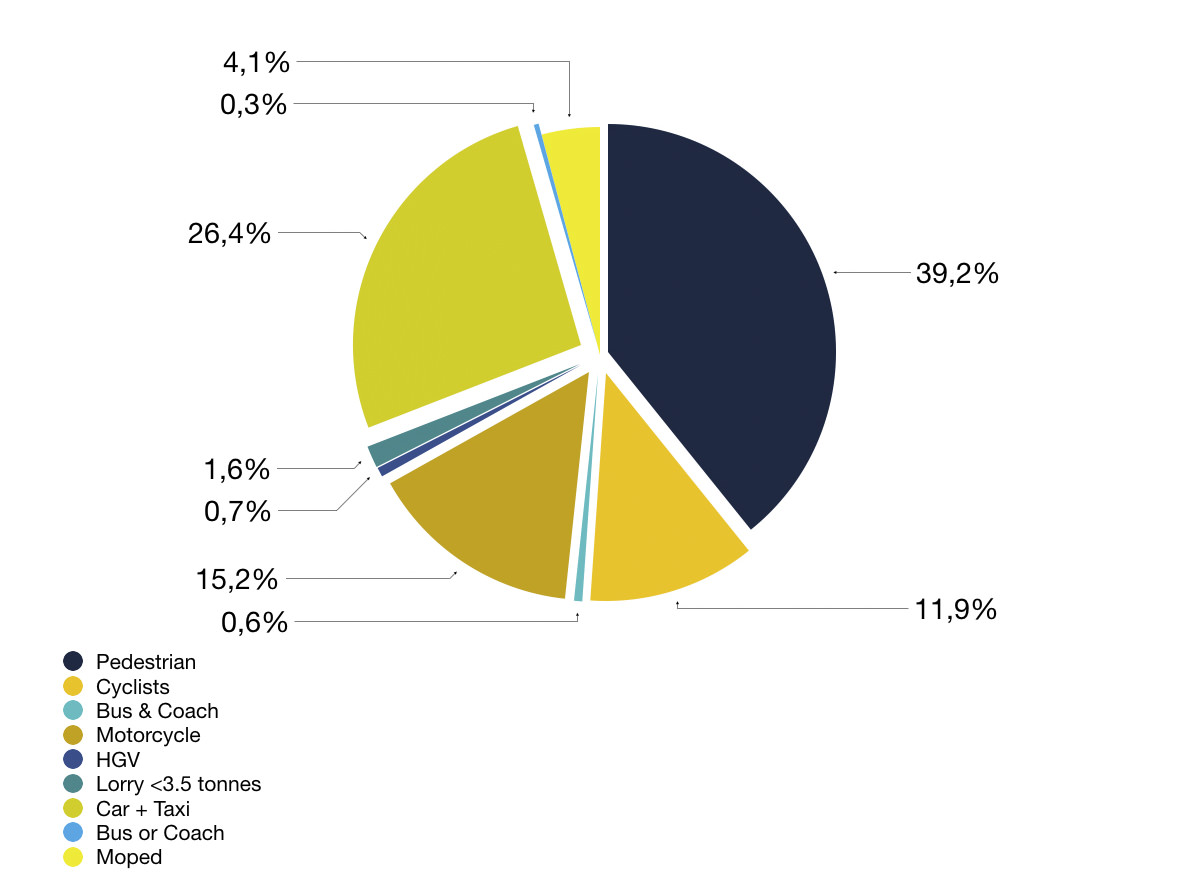
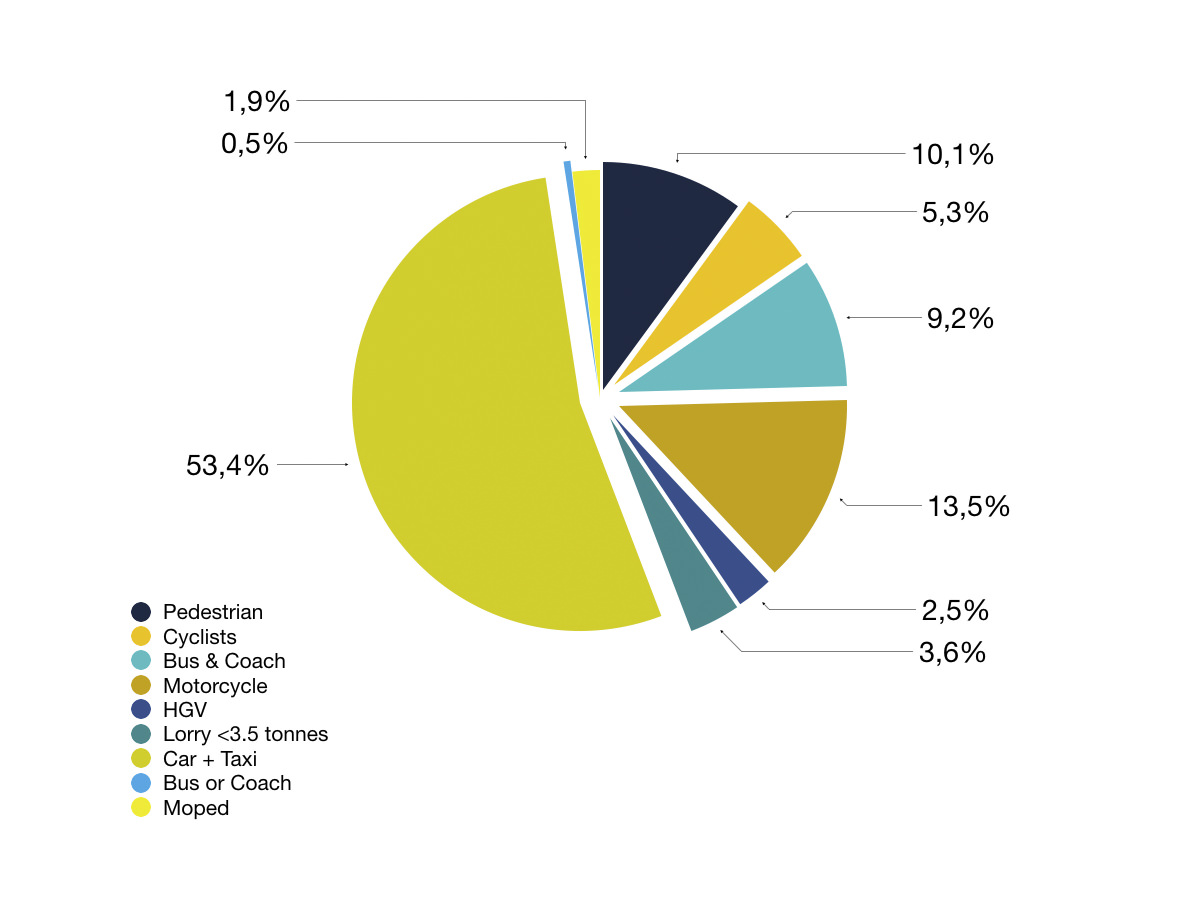
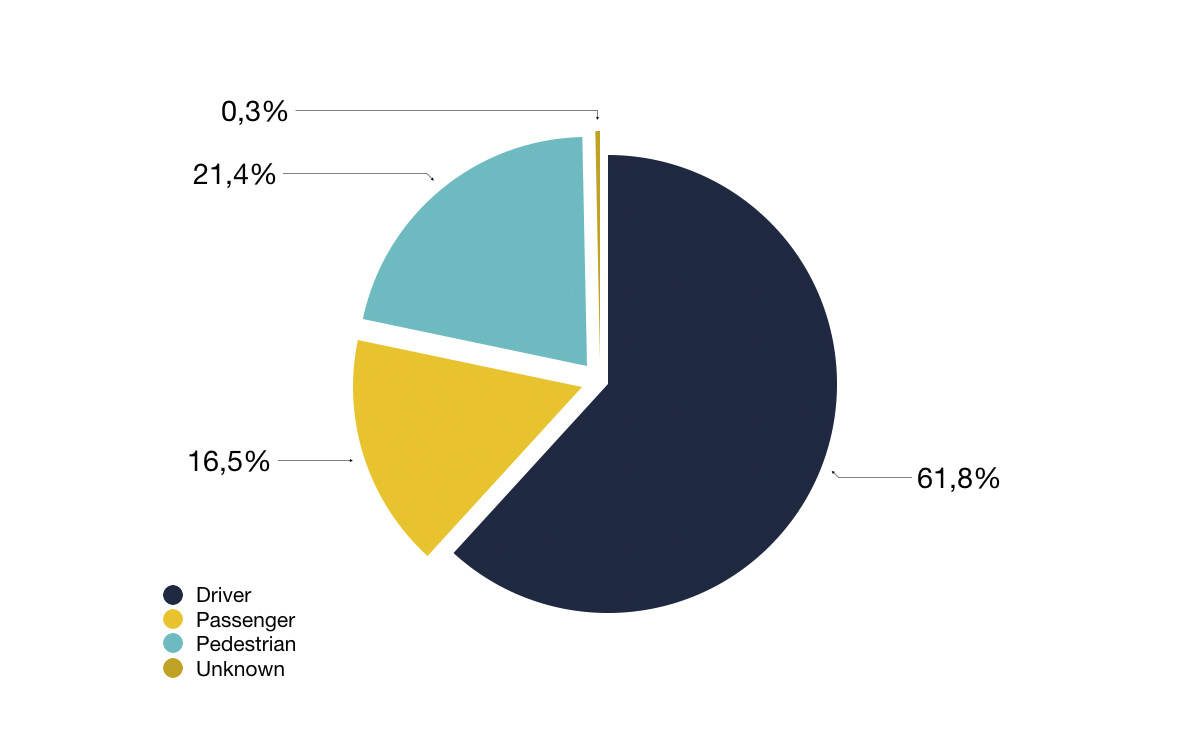
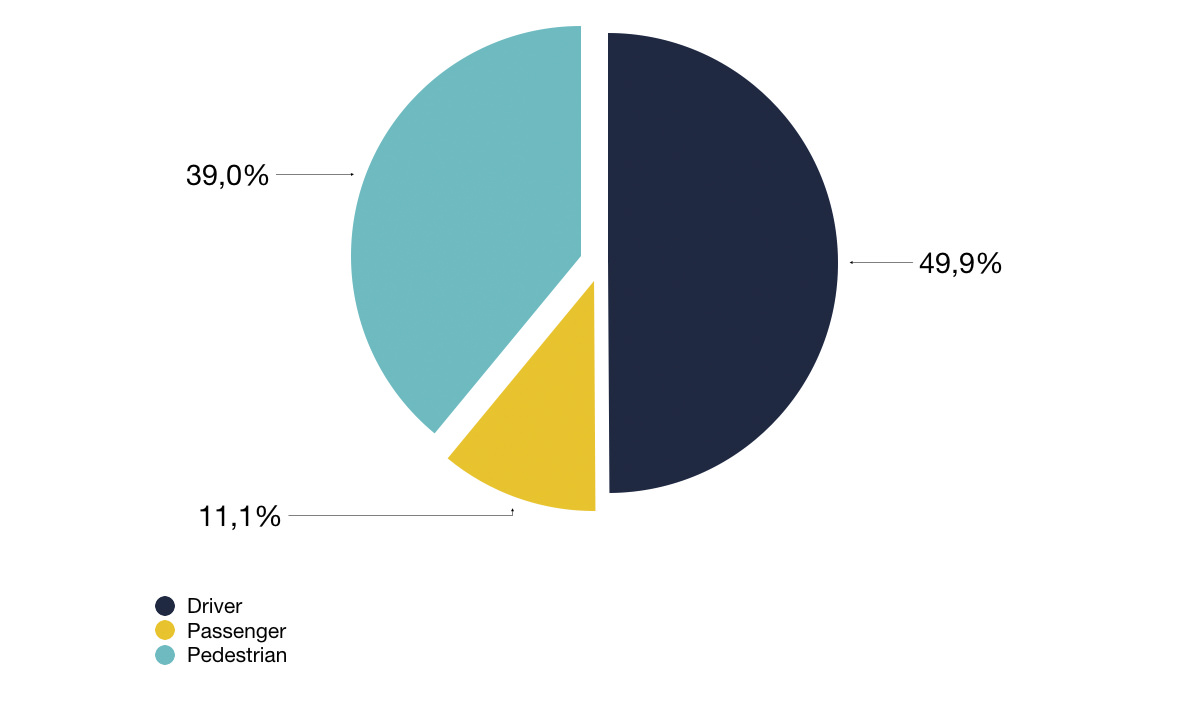
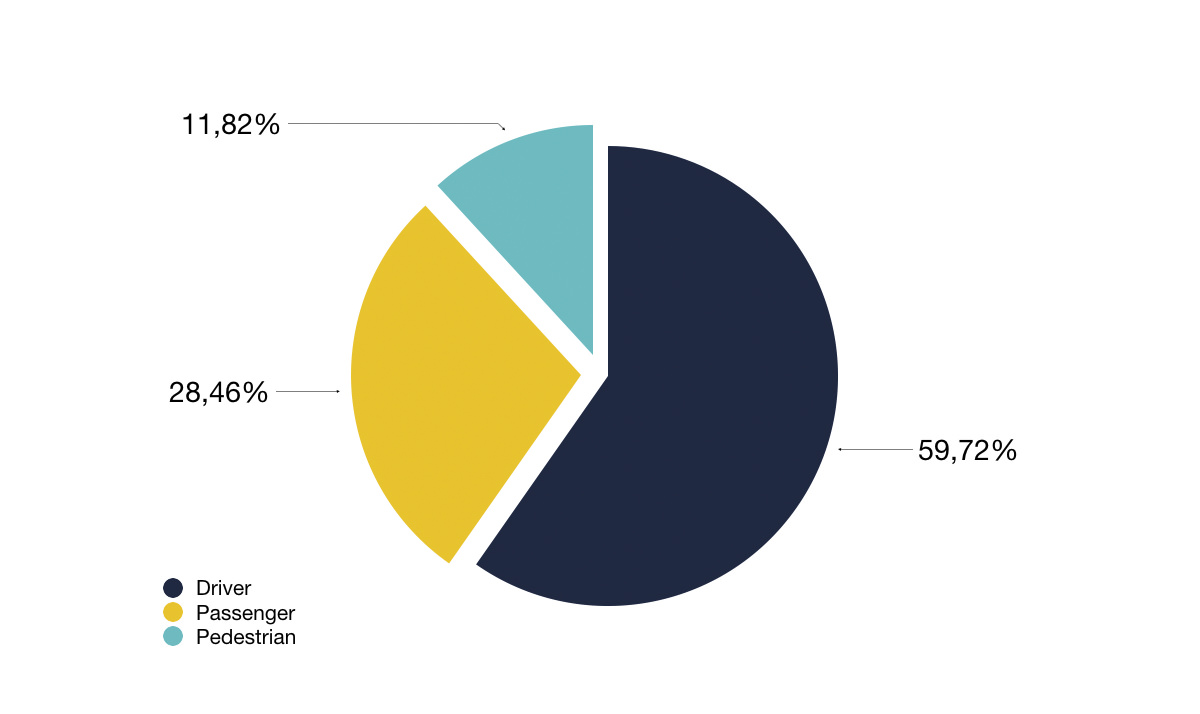
7.8 Road fatalities by mode of transport in EU 28, 2015
7.8.1 TOTAL
7.8.2 INSIDE URBAN AREA
7.8.3 OUTSIDE URBAN AREA
Source: CARE (EU road accidents database) or national publications
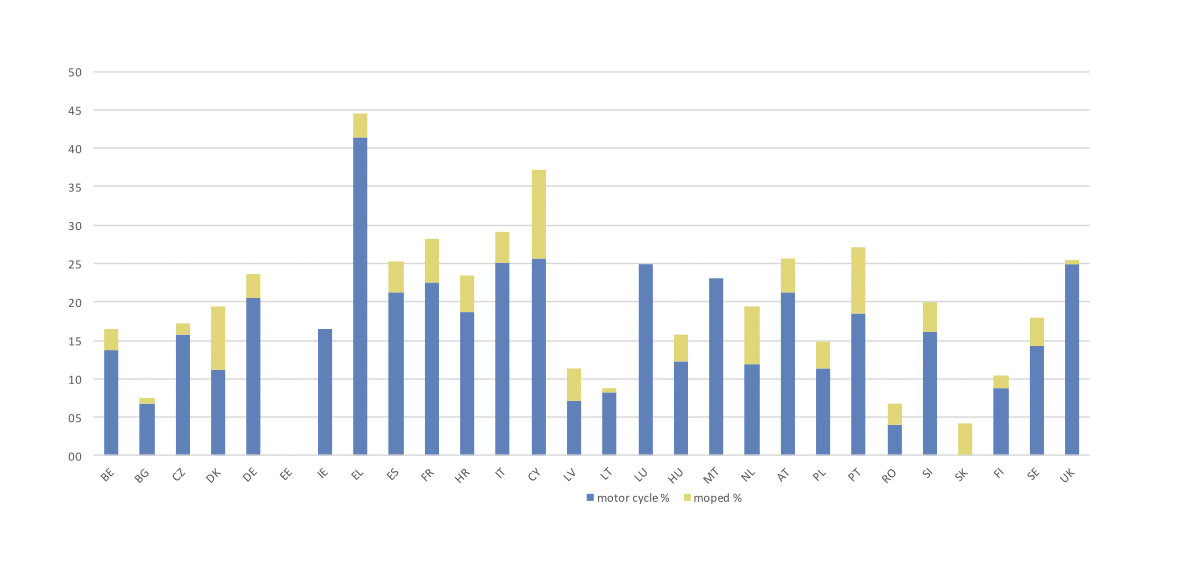
7.9 PTWs fatalities in selected EU countries, 2015 (%)
Source: CARE database (DG Mobility and Transport), national sources.
Notes: Persons deceased within 30 days of their accident.
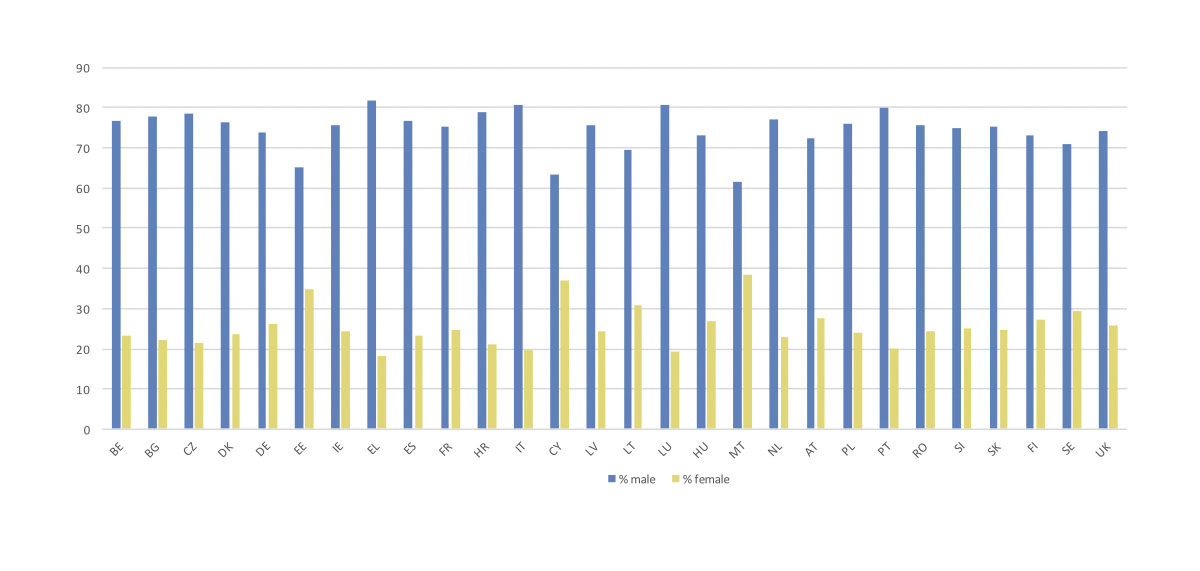
7.10 Road fatalities by gender in EU countries, 2015 (%)
| Source: CARE | BE, DK, EL, PL, SE & UK | 2014 figures |
| BG | 2009 figures | |
| MT, SK | 2010 figures | |
| IE | 2013 figures |
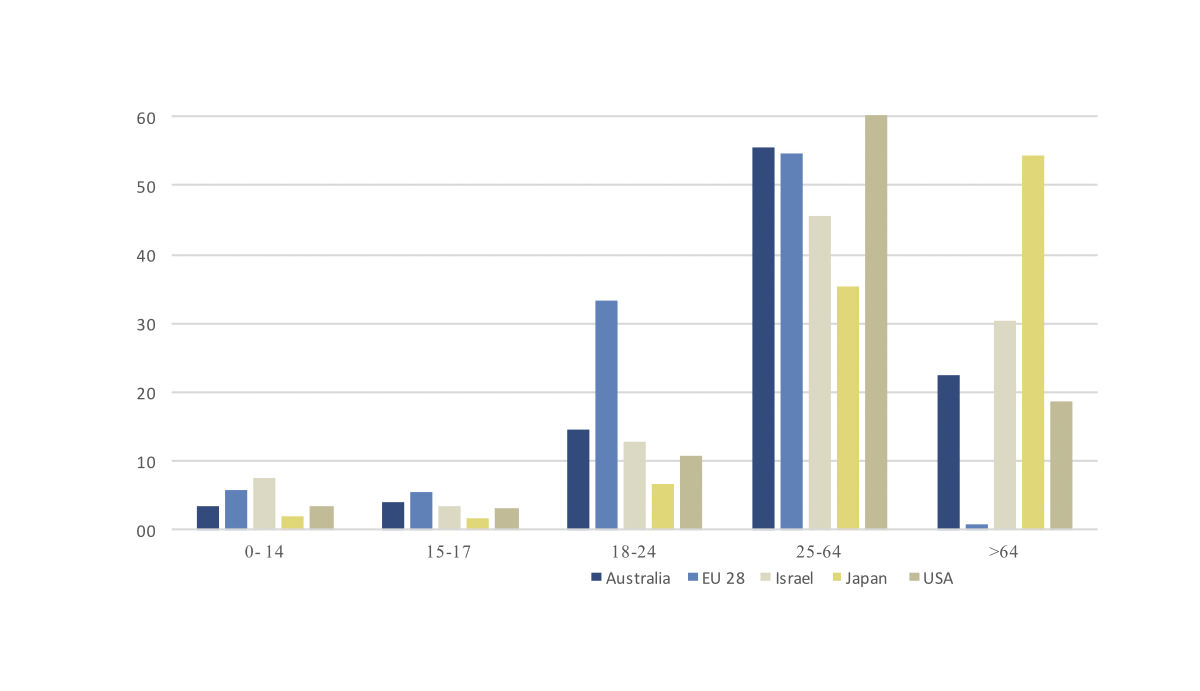
7.11 Road fatalities by age group in EU 28 and selected countries, 2015 (%)
Source: IRTAD, CARE, OECD
Data and figures, EU: 2015, Australia: 2015, Israel: 2015, USA:2014, Japan:2014 figures
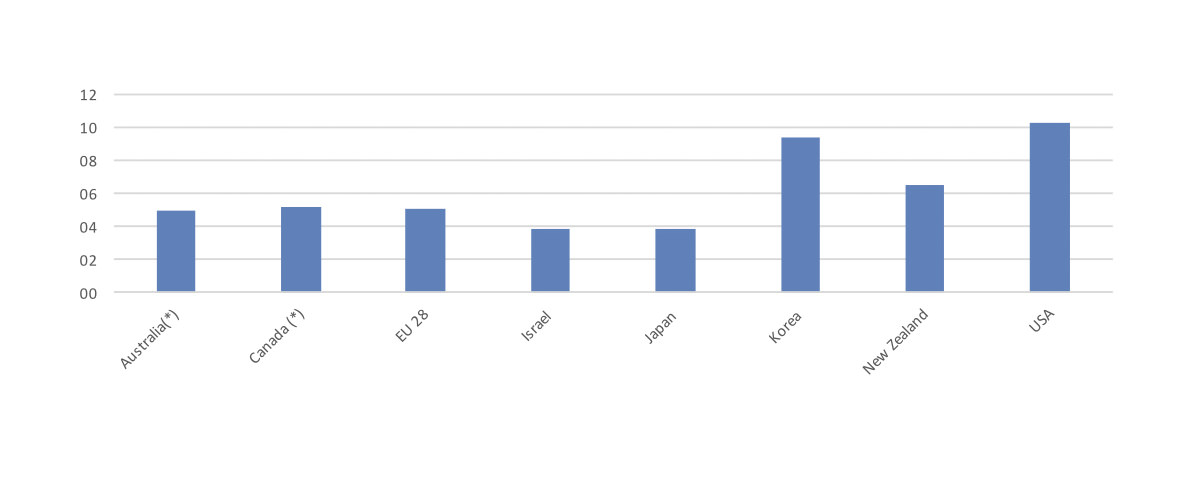
7.12 Road Fatalities (per 100,000 population) in EU 28 and selected countries, 2014
Source: OECD
* Figures & Data, USA: 2014, Australia: 2014, Canada:2014, Israel:2015, Japan:2014, Korea: 2014, Newzealanad:2014
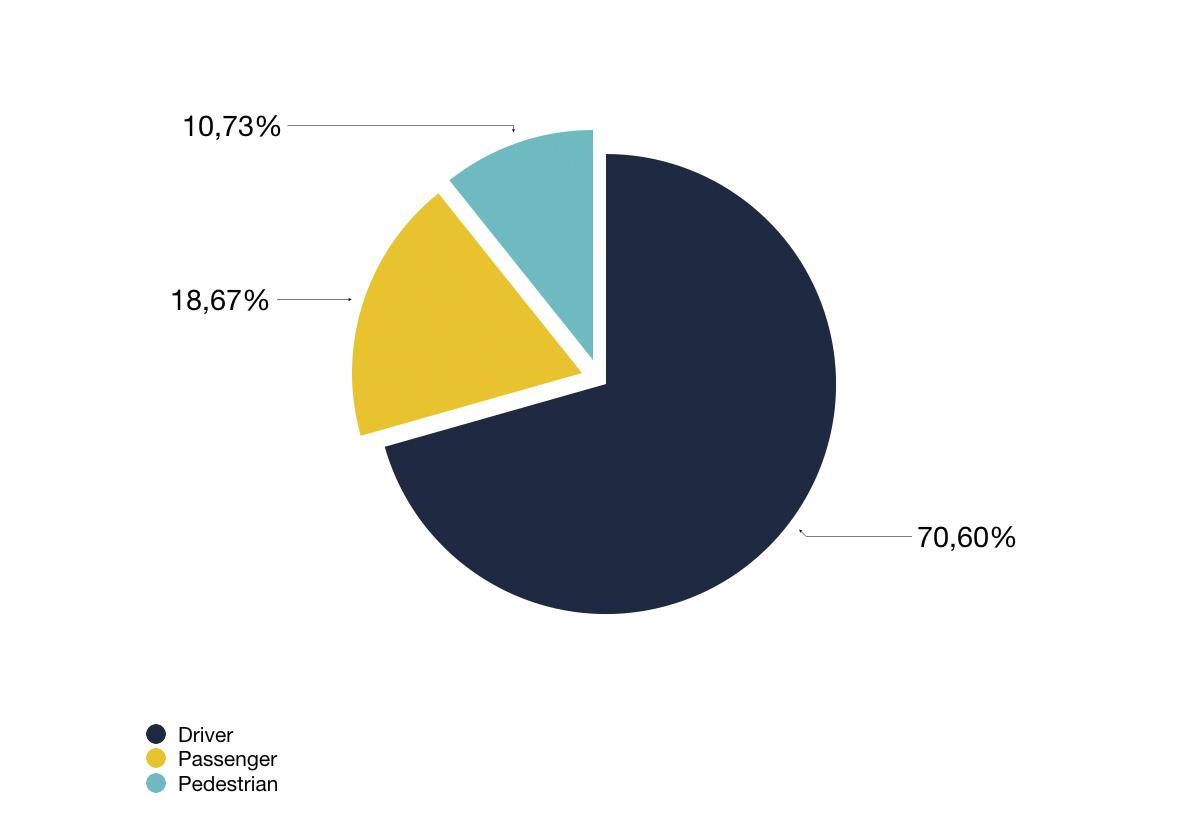
7.14 Fatalities at 30 days by road user type in EU countries
7.14.1 Total
7.14.2 Urban
7.14.3 Motorway
7.14.4 Rural
Source: CARE

