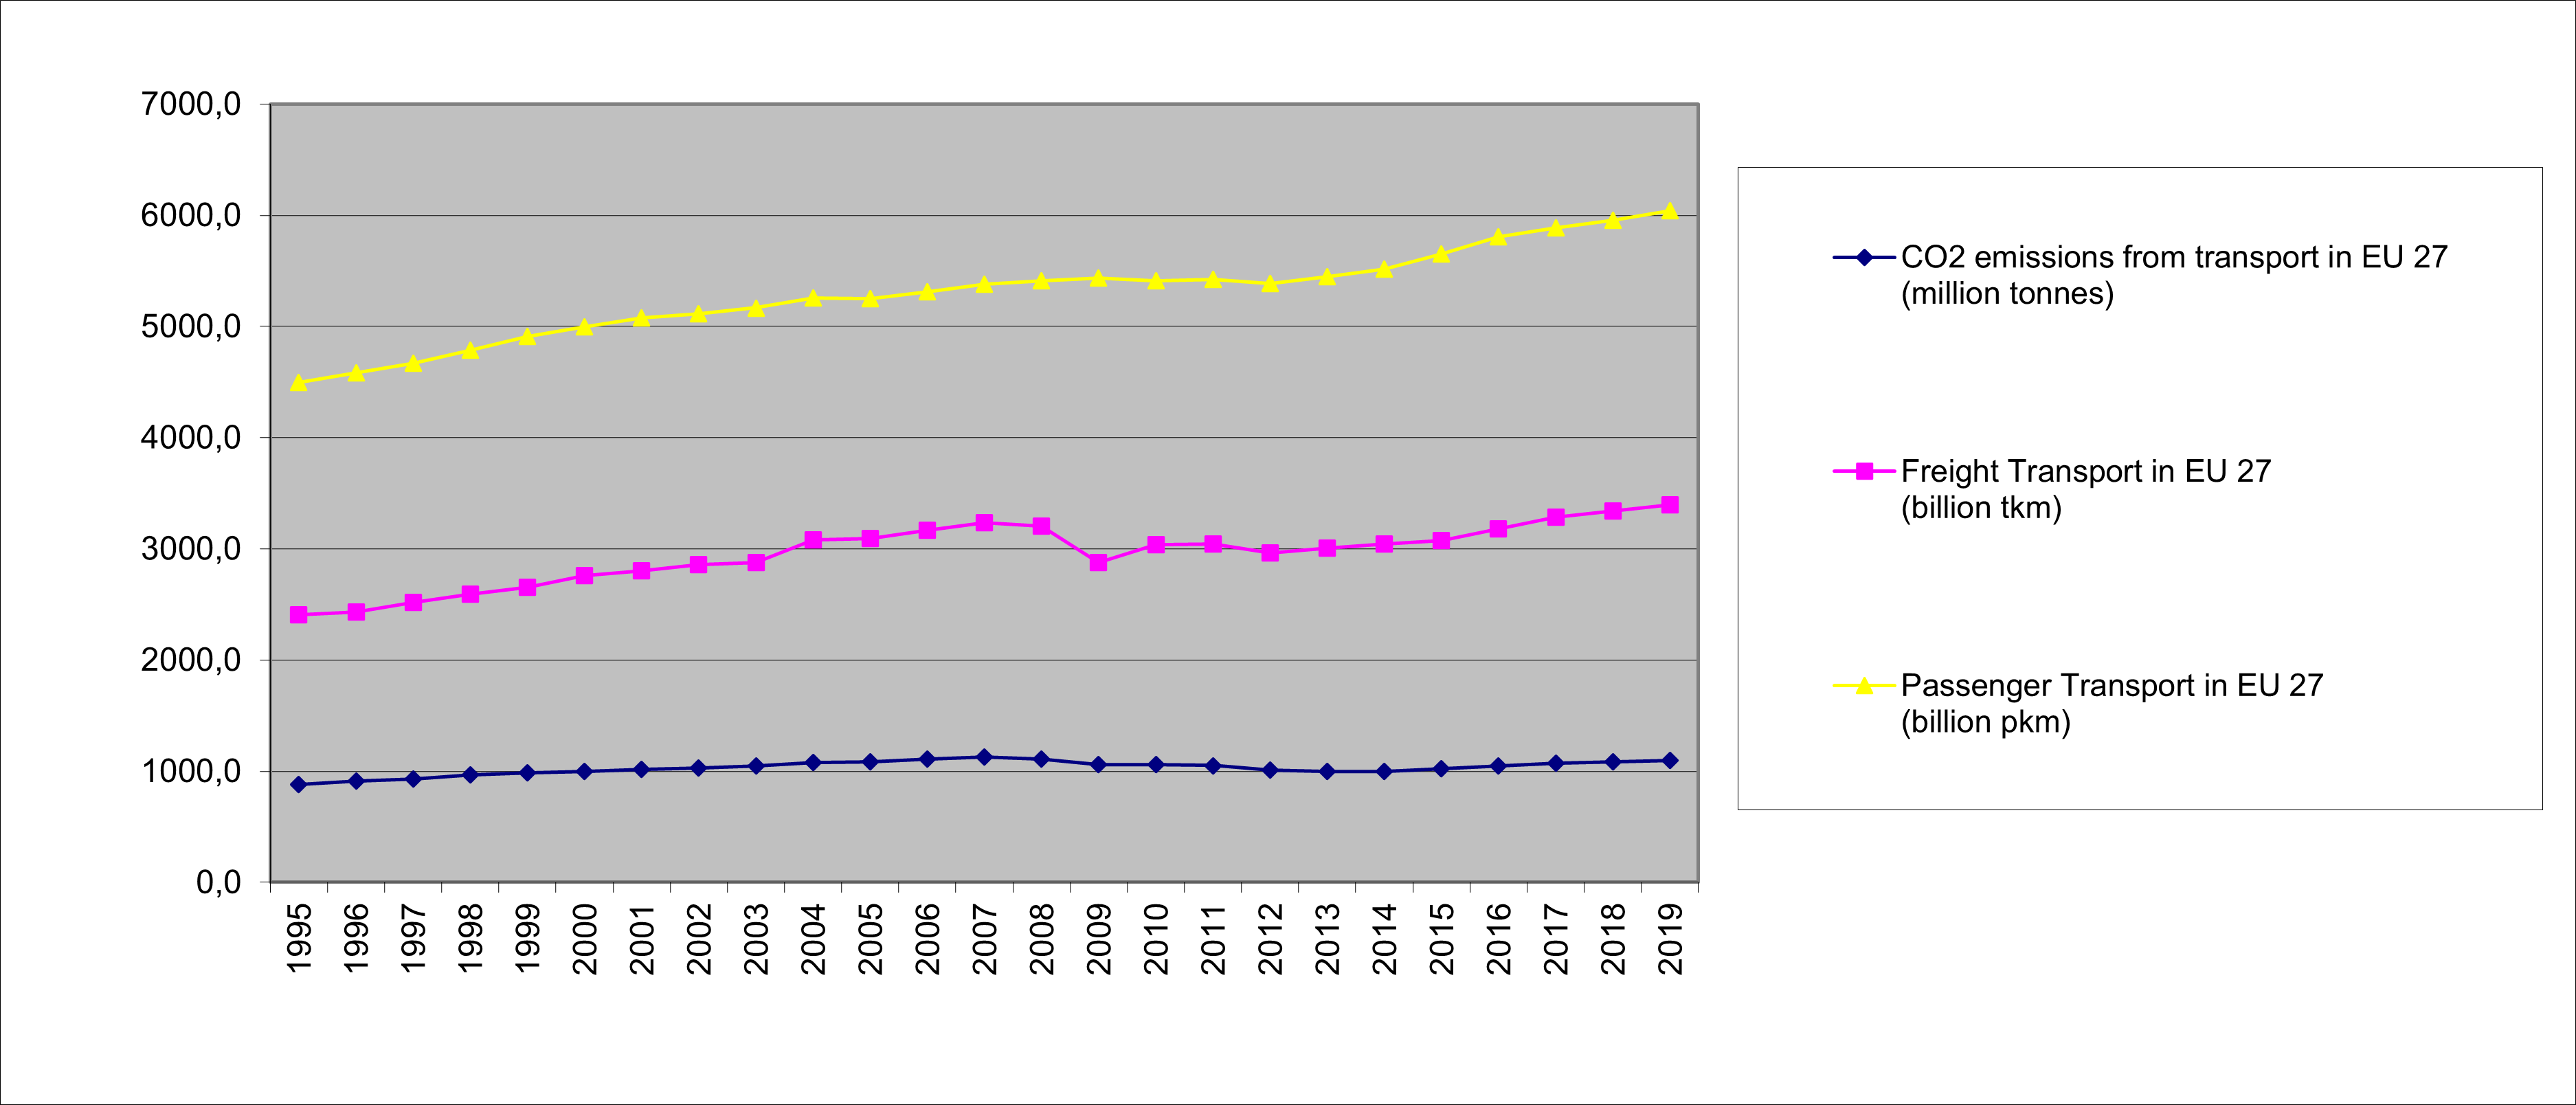
9.1 Comparison between freight & passenger transport evolution and CO2 emissions in EU 27, 1995-2019
Source: European Environment Agency (EEA), June 2021
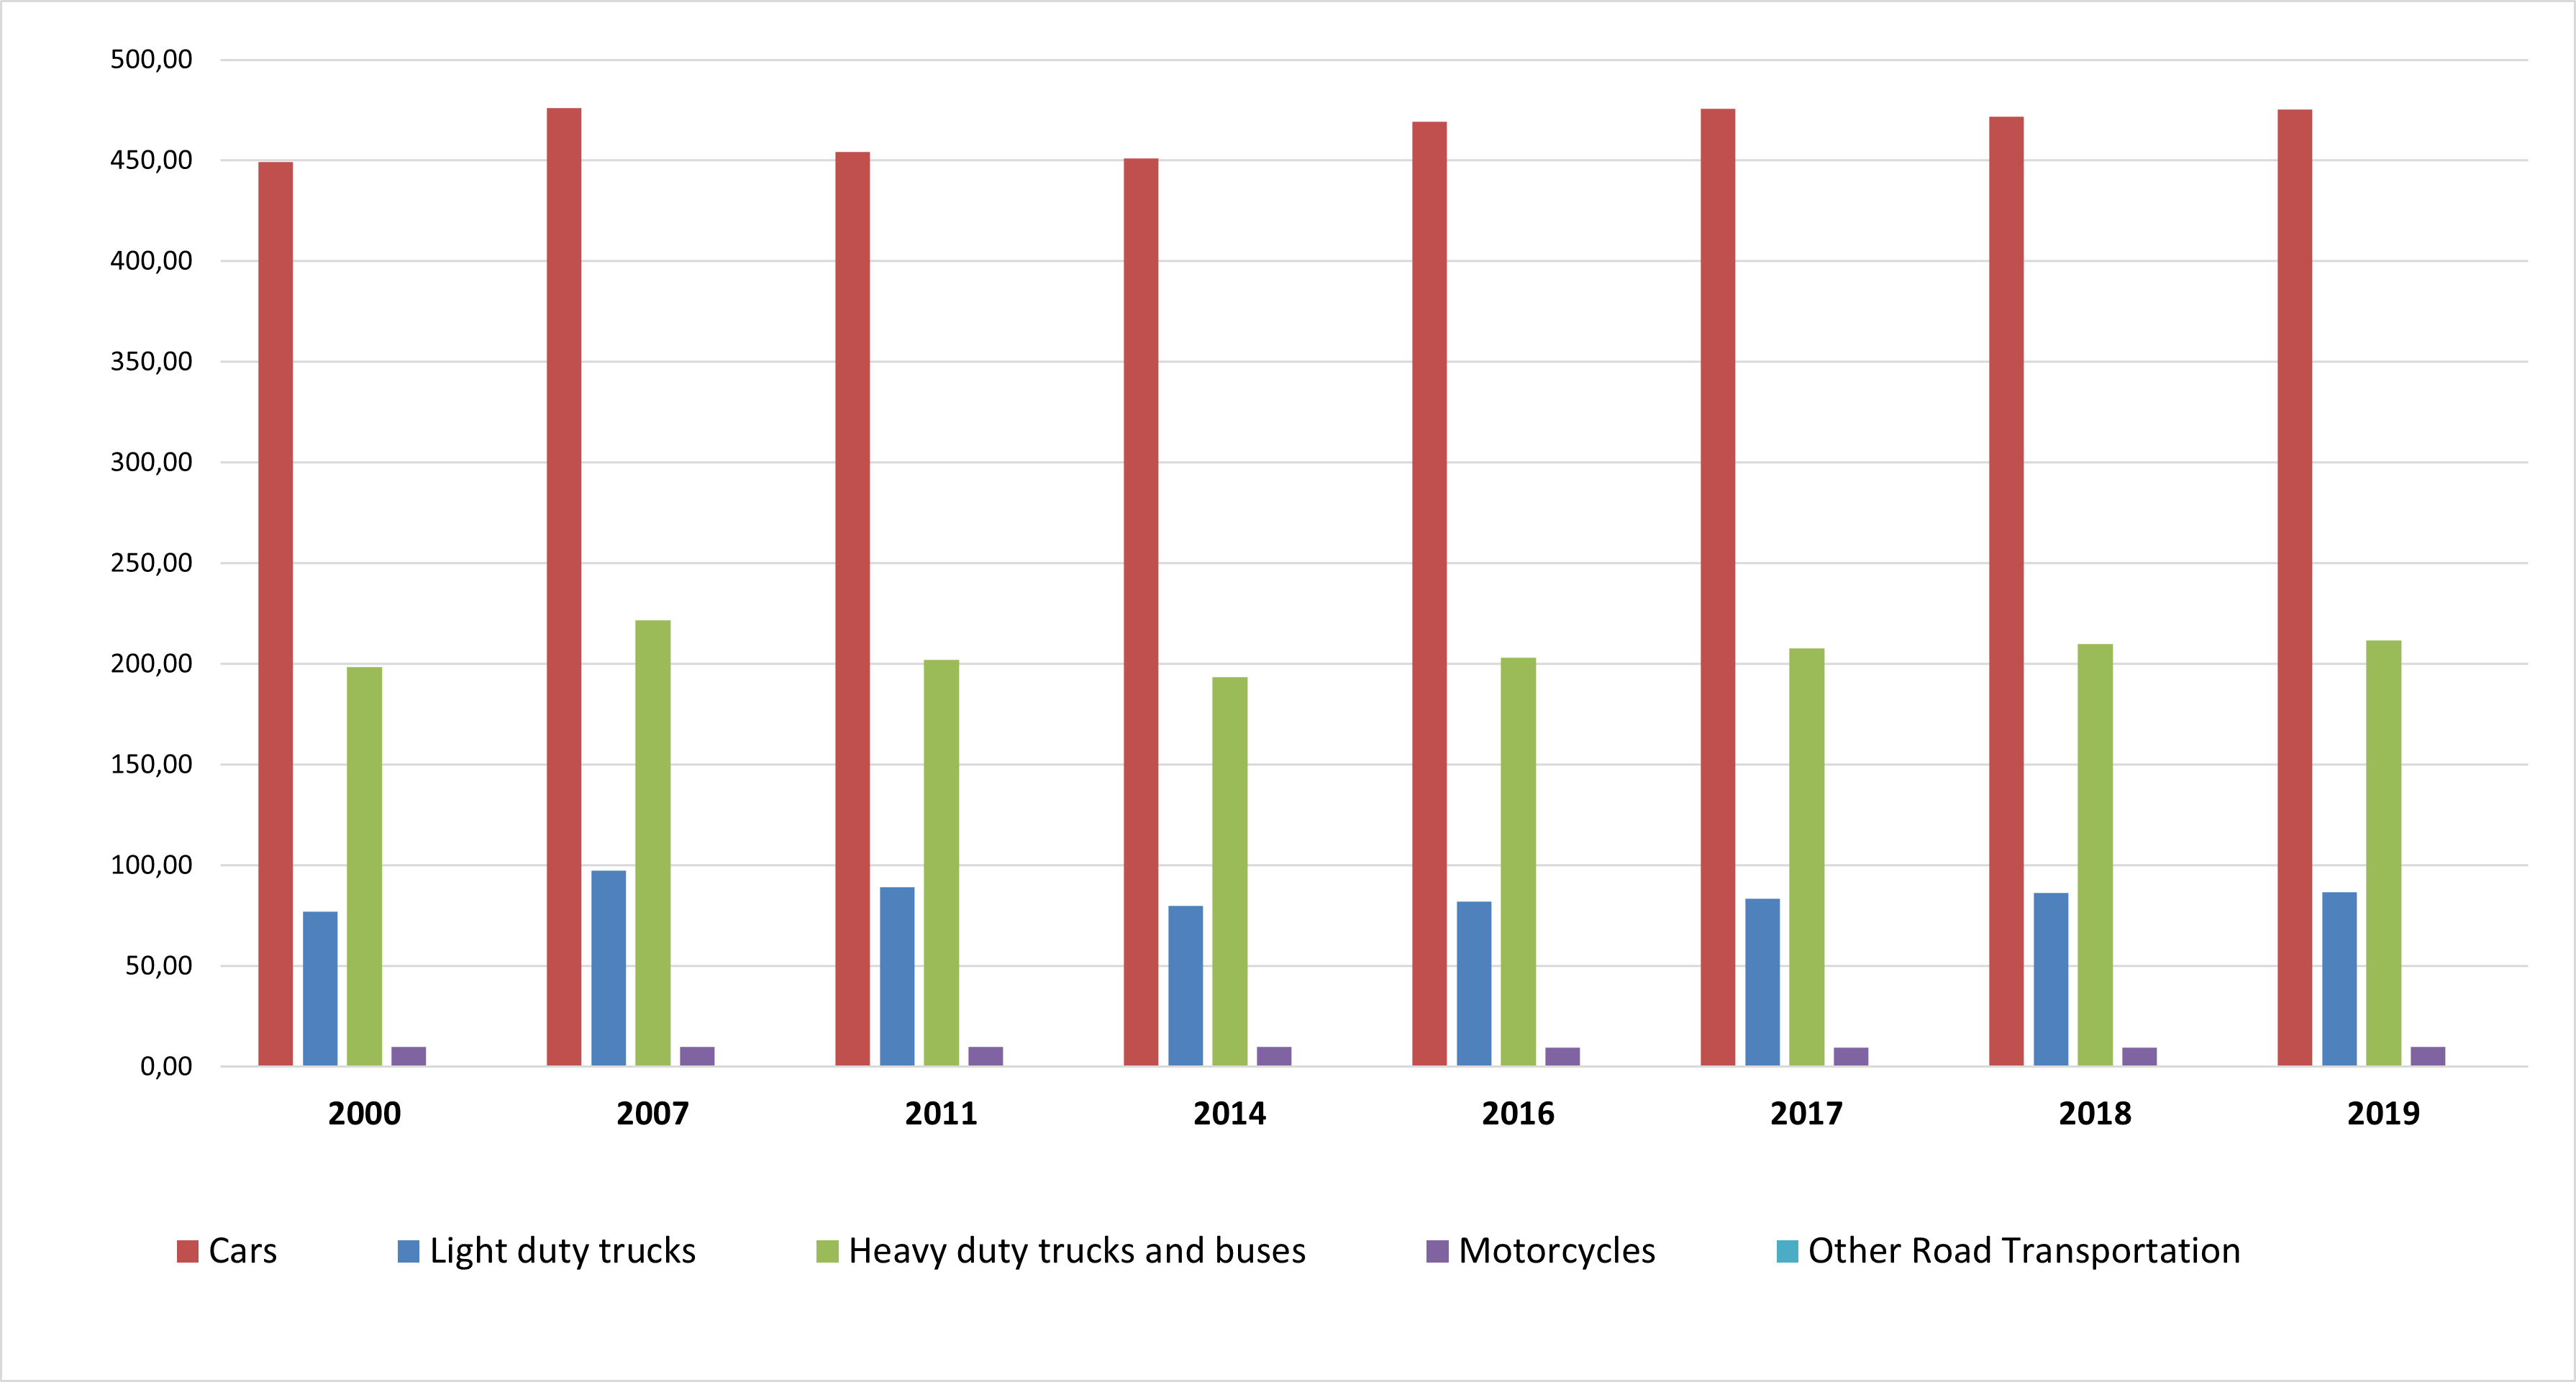
9.2 CO2 emissions from Road transport in EU 27, 2000-2019 ( Million tonnes CO2 equivalent)
Source: European Environment Agency (EEA), June 2021
9.3 CO2 Emissions from Road Transport, by Transport Mean: EU-27
Source: European Environment Agency (EEA), June 2021
9.4 Average CO2 emissions per km from new passenger cars in EU, 2019-2020
9.4.1 Average CO2 emissions in EU countries, 2019 - 2020 (g CO2 / km)
| 2019 | 2020 | Evolution 2019-2020 | |
| BE | 121,5 | 107,7 | -11,4% |
| BG | 130,2 | 133 | 2,2% |
| CZ | 128,7 | 120,9 | -6,1% |
| DK | 111,9 | 95,3 | -14,8% |
| DE | 131,2 | 113,6 | -13,4% |
| EE | 130,1 | 121 | -7,0% |
| IE | 113,8 | 106,2 | -6,7% |
| EL | 115,6 | 107,3 | -7,2% |
| ES | 121,3 | 112,4 | -7,3% |
| FR | 113,8 | 98,5 | -13,4% |
| HR | 119,4 | 112,2 | -6,0% |
| IT | 119,4 | 108,6 | -9,0% |
| CY | 126,7 | 125 | -1,3% |
| LV | 127,9 | 119,2 | -6,8% |
| LT | 132 | 119,3 | -9,6% |
| LU | 133 | 119,8 | -9,9% |
| HU | 129,7 | 116,7 | -10,0% |
| MT | 109,1 | 101,4 | -7,1% |
| NL | 98,4 | 82,3 | -16,4% |
| AT | 125,5 | 113 | -10,0% |
| PL | 130,4 | 125 | -4,1% |
| PT | 109,4 | 97,5 | -10,9% |
| RO | 124,3 | 115,4 | -7,2% |
| SI | 123,8 | 114,1 | -7,8% |
| SK | 130,4 | 121,8 | -6,6% |
| FI | 115,3 | 100,3 | -13,0% |
| SE | 119,7 | 93,4 | -22,0% |
| EU 27 | 122,1 | 108,2 | -11,4% |
Source: Eurostat
9.4.2 Evolution in CO2 emissions in EU countries, 2019 - 2020 (%)
Source: EEA
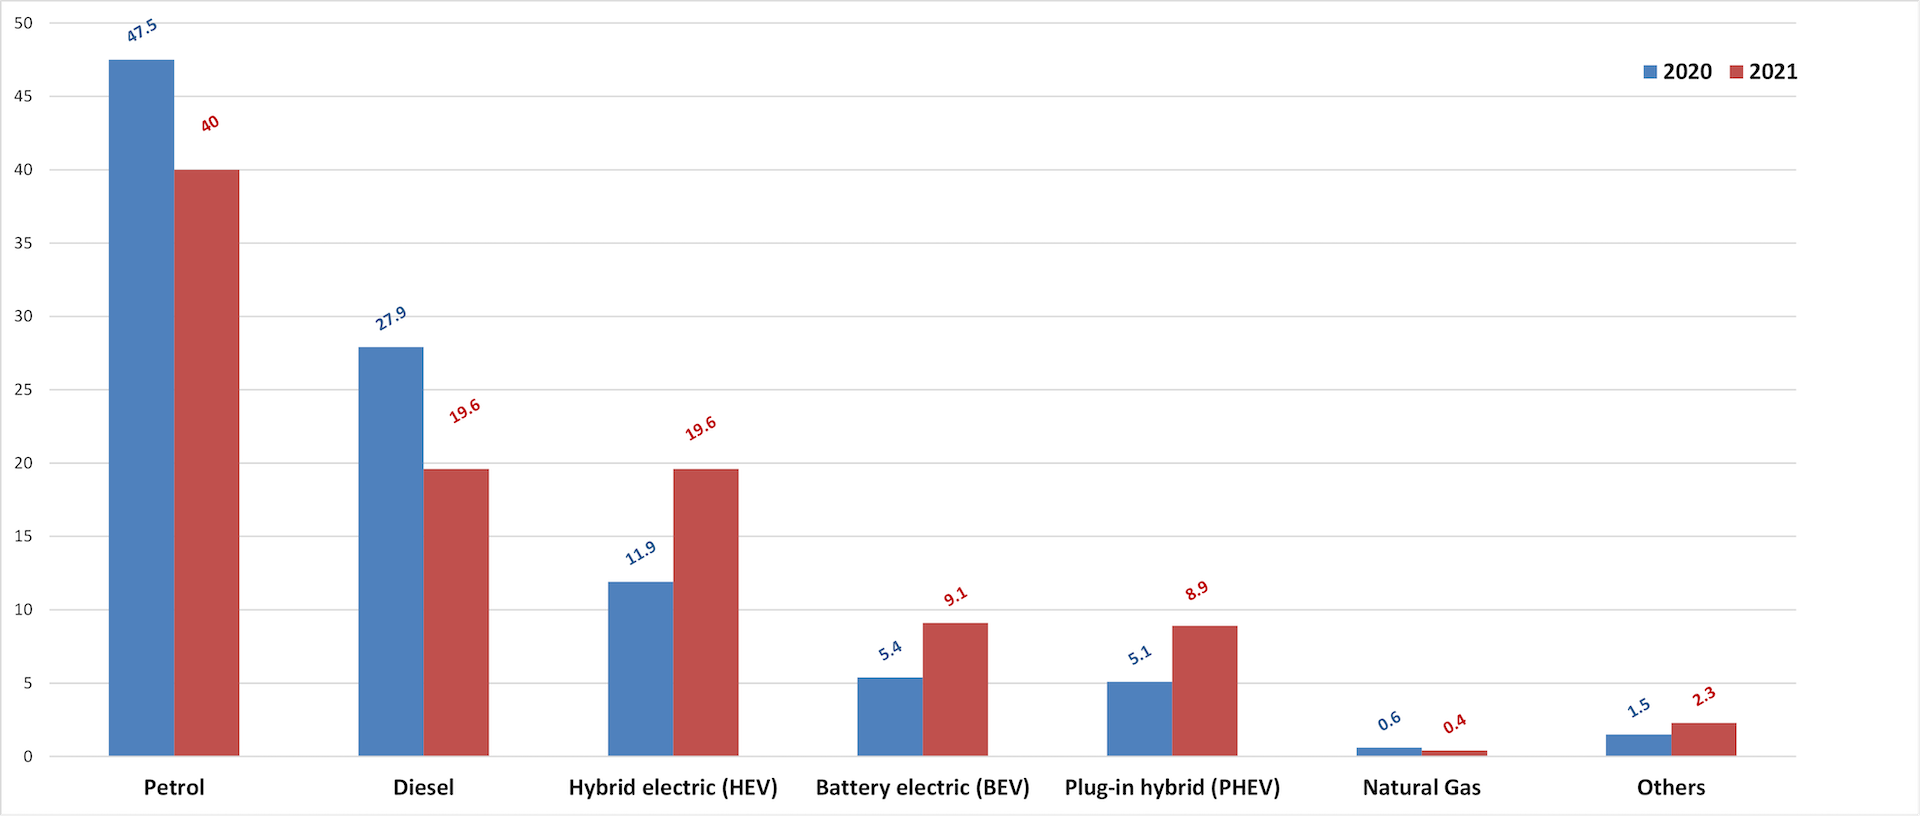
9.5 Fuel market share for new car registrations in EU, 2020-2021
Source: ACEA
9.6 Pure Biodiesel production capacity in EU countries, 2011-2020 (1000 tonnes)
| 2011 | 2012 | 2013 | 2014 | 2015 | 2016 | 2017 | 2018 | 2019 | 2020 | |
| BE | 665,0 | 665,0 | 665,0 | 665,0 | 450,0 | 450,0 | 450,0 | 450,0 | 450,0 | 450,0 |
| BG | 93,7 | 63,7 | 63,7 | 163,7 | 160,0 | 160,0 | 160,0 | 160,0 | 180,0 | 180,0 |
| CZ | 420,0 | 420,0 | 420,0 | 420,0 | 420,0 | 420,0 | 420,0 | 420,0 | 420,0 | 420,0 |
| DK | — | — | — | — | — | — | — | — | — | — |
| DE | 4.494,0 | 4.296,0 | 4.308,0 | 4.161,0 | 4.212,0 | 4.125,0 | 4.153,0 | 4.279,0 | 4.171,0 | 3.793,0 |
| EE | — | — | — | — | — | — | — | — | — | — |
| IE | 34,3 | 29,9 | 29,9 | 29,9 | 29,9 | 29,9 | 35,2 | 35,2 | 35,2 | 57,2 |
| EL | 746,8 | 746,8 | 980,5 | 973,1 | 993,9 | 993,9 | 1.045,4 | 1.045,4 | 1.045,4 | 1.135,4 |
| ES | 4.341,0 | 3.762,0 | 4.243,0 | 4.237,0 | 4.237,0 | 4.237,0 | 4.237,0 | 4.237,0 | 4.237,0 | 4.237,0 |
| FR | 2.760,0 | 2.760,0 | 2.760,0 | 2.760,0 | 2.760,0 | 2.305,0 | 2.305,0 | 2.305,0 | 2.305,0 | 2.305,0 |
| HR | 64,0 | 69,0 | 69,0 | 63,8 | 63,8 | 41,0 | 41,0 | 41,0 | 41,0 | 41,0 |
| IT | 2.212,2 | 2.212,2 | 2.212,2 | 2.212,2 | 2.212,2 | 2.212,2 | 2.212,2 | 2.212,2 | 2.212,2 | 2.212,2 |
| CY | 14,1 | 14,1 | 14,1 | 14,1 | 14,1 | 5,0 | 5,0 | 5,0 | 5,0 | 0,0 |
| LV | 173,0 | 173,0 | 173,0 | 173,0 | 173,0 | 173,0 | 173,0 | 173,0 | 173,0 | 173,0 |
| LT | 150,0 | 140,0 | 140,0 | 140,0 | 140,0 | 140,0 | 140,0 | 156,0 | 195,0 | 195,0 |
| LU | — | — | — | — | — | — | — | — | — | — |
| HU | 189,0 | 150,0 | 150,0 | 150,0 | 150,0 | 157,0 | 172,0 | 180,0 | 180,0 | 180,0 |
| MT | 1,1 | 1,4 | 1,4 | 1,4 | 1,4 | 1,4 | 1,4 | — | — | — |
| NL | 2.030,0 | 2.051,0 | 2.014,0 | 2.196,0 | 2.176,0 | 1.927,0 | 2.058,0 | 2.082,0 | 2.124,0 | 2.141,0 |
| AT | 645,5 | 645,5 | 645,5 | 645,5 | 645,5 | 645,5 | 645,5 | 645,5 | 645,5 | 645,5 |
| PL | 755,1 | 922,5 | 798,3 | 876,6 | 1.157,4 | 1.035,9 | 1.188,9 | 1.368,6 | 1.368,6 | 1.576,9 |
| PT | 682,3 | 721,3 | 721,3 | 721,3 | 721,3 | 721,3 | 721,3 | 721,3 | 721,3 | 721,3 |
| RO | 0,0 | 206,5 | 206,5 | 206,5 | 200,0 | 200,0 | 200,0 | 200,0 | 210,0 | 300,0 |
| SI | 25,0 | 25,0 | 25,0 | — | — | — | — | — | — | — |
| SK | 168,0 | 120,0 | 142,0 | 130,0 | 177,0 | 125,0 | 125,0 | 125,0 | 125,0 | 135,0 |
| FI | 380,0 | 380,0 | 380,0 | 380,0 | 480,0 | 480,0 | 490,0 | 500,0 | 500,0 | 500,0 |
| SE | 117,3 | 285,8 | 285,8 | 261,1 | 310,0 | 132,5 | 132,0 | 450,0 | 450,0 | 450,0 |
| EU-27 | 21.161,5 | 20.860,7 | 21.448,2 | 21.581,2 | 21.884,5 | 20.717,6 | 21.111,0 | 21.791,3 | 21.794,3 | 21.848,5 |
Source: Eurostat
9.7 Renewable energy source share in transport EU-27, 2010-2019 (%)
% Renewable energy sources in transport
Source: Eurostat
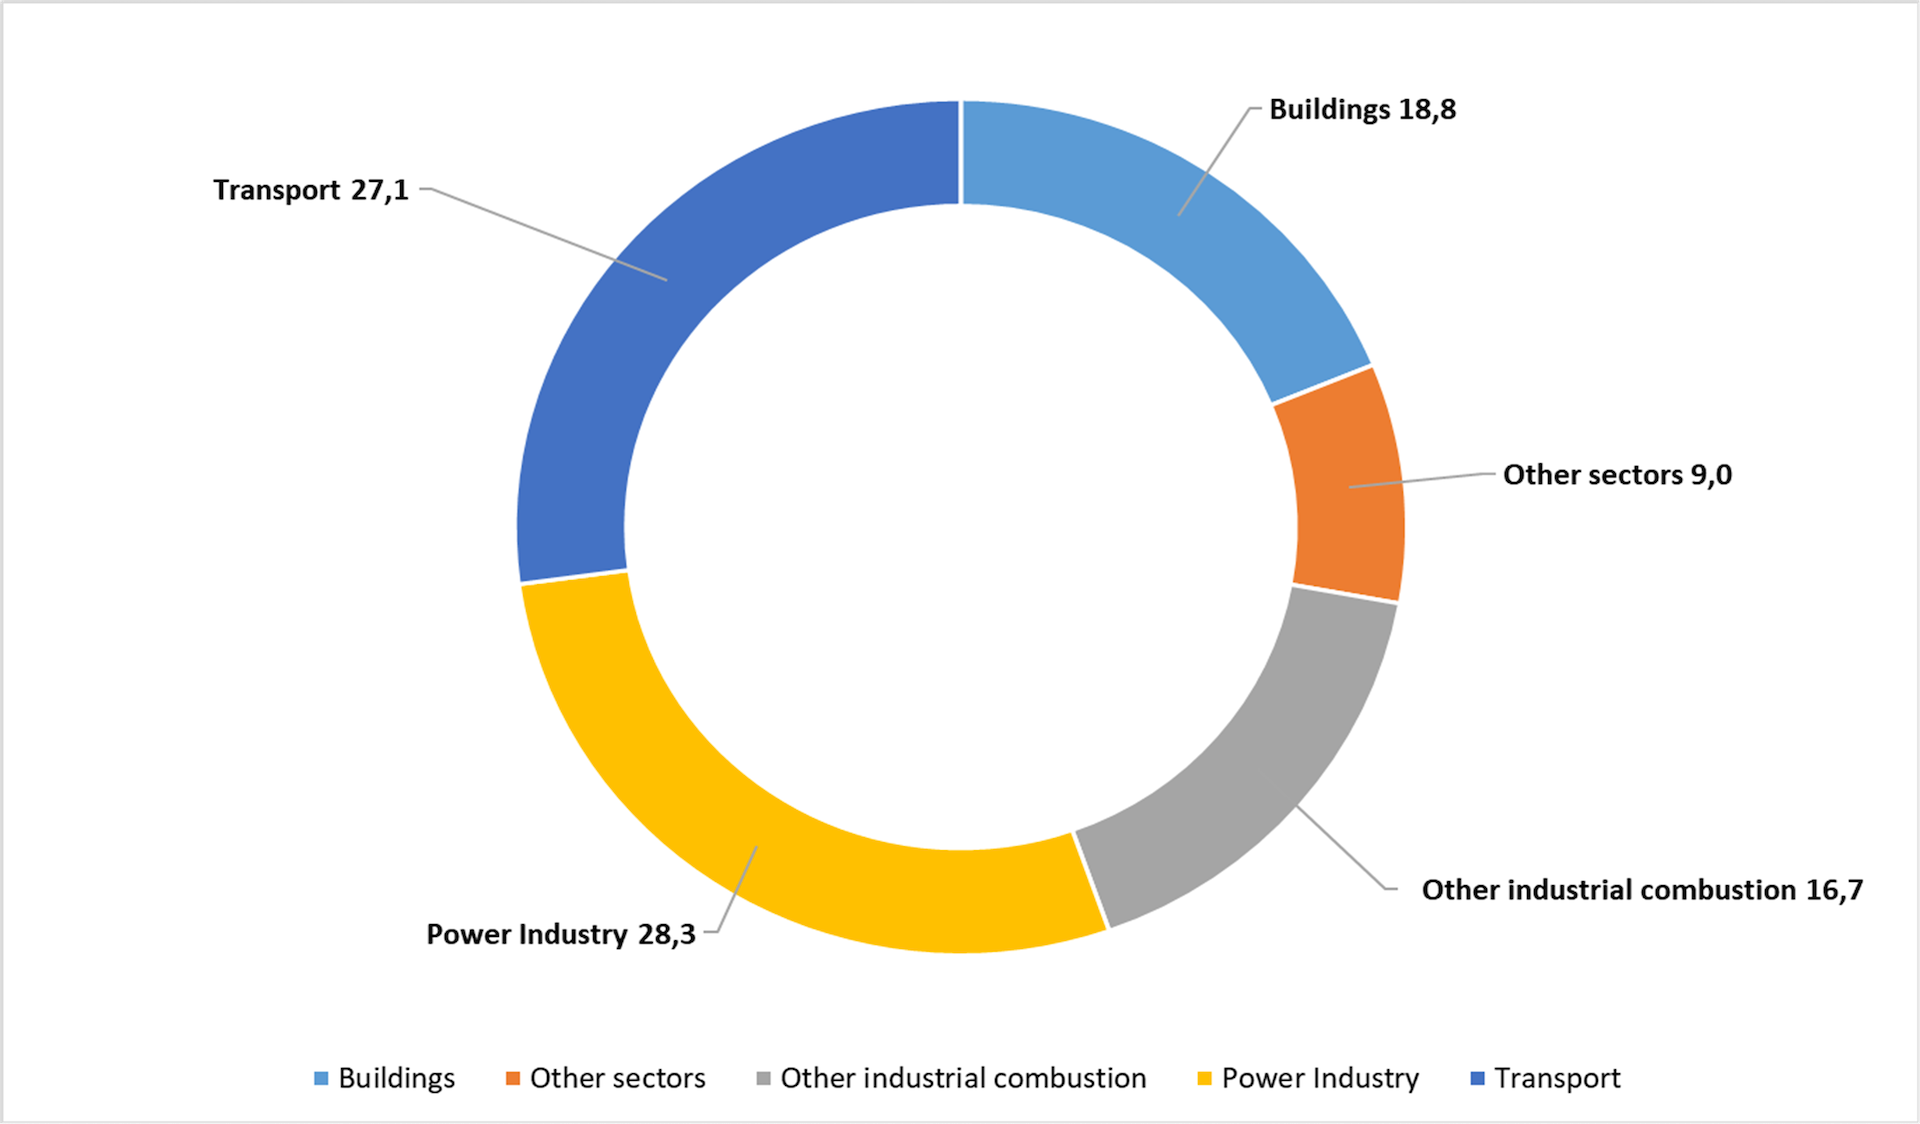
9.8 Share of total CO2 emissions from fossil fuel by sector in EU27+UK (Mt CO2), 2019
Source: JRC – EDGAR
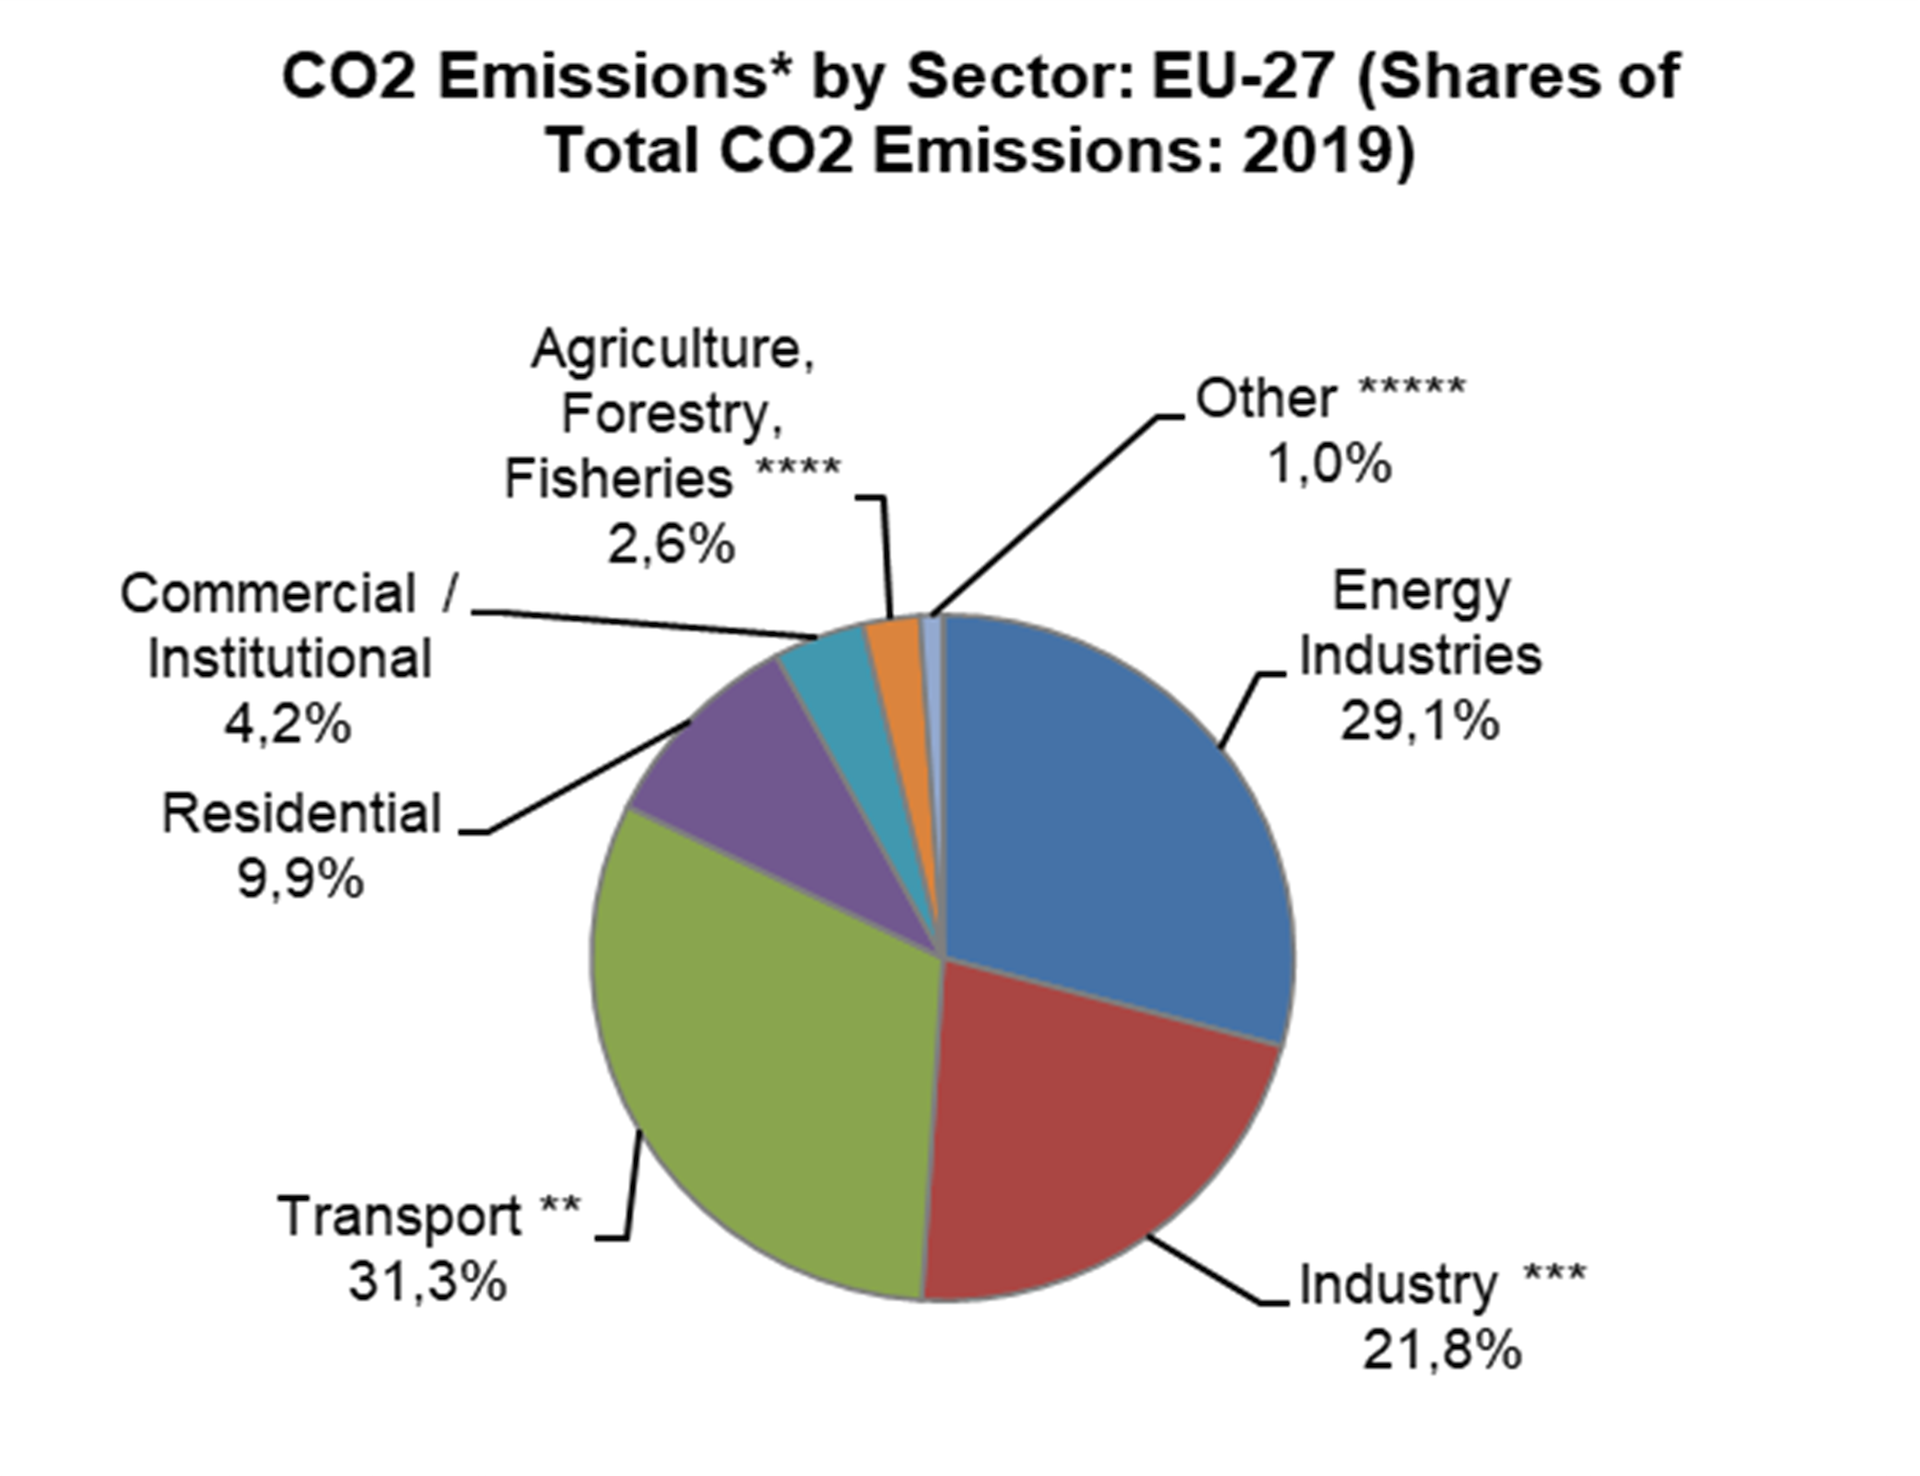
9.9 CO2 emissions by sector in EU (Mt CO2), 2019
Notes:
* Excluding LULUCF emissions and international maritime, including international aviation and indirect CO2.
** Excluding international maritime (international traffic departing from the EU), including international aviation.
*** Emissions from Manufacturing and Construction, Industrial Processes and Product Use.
**** Emissions from Fuel Combustion and other Emissions from Agriculture.
***** Emissions from Other (Not elsewhere specified), Fugitive Emissions from Fuels, Waste, Indirect CO2 and Other.
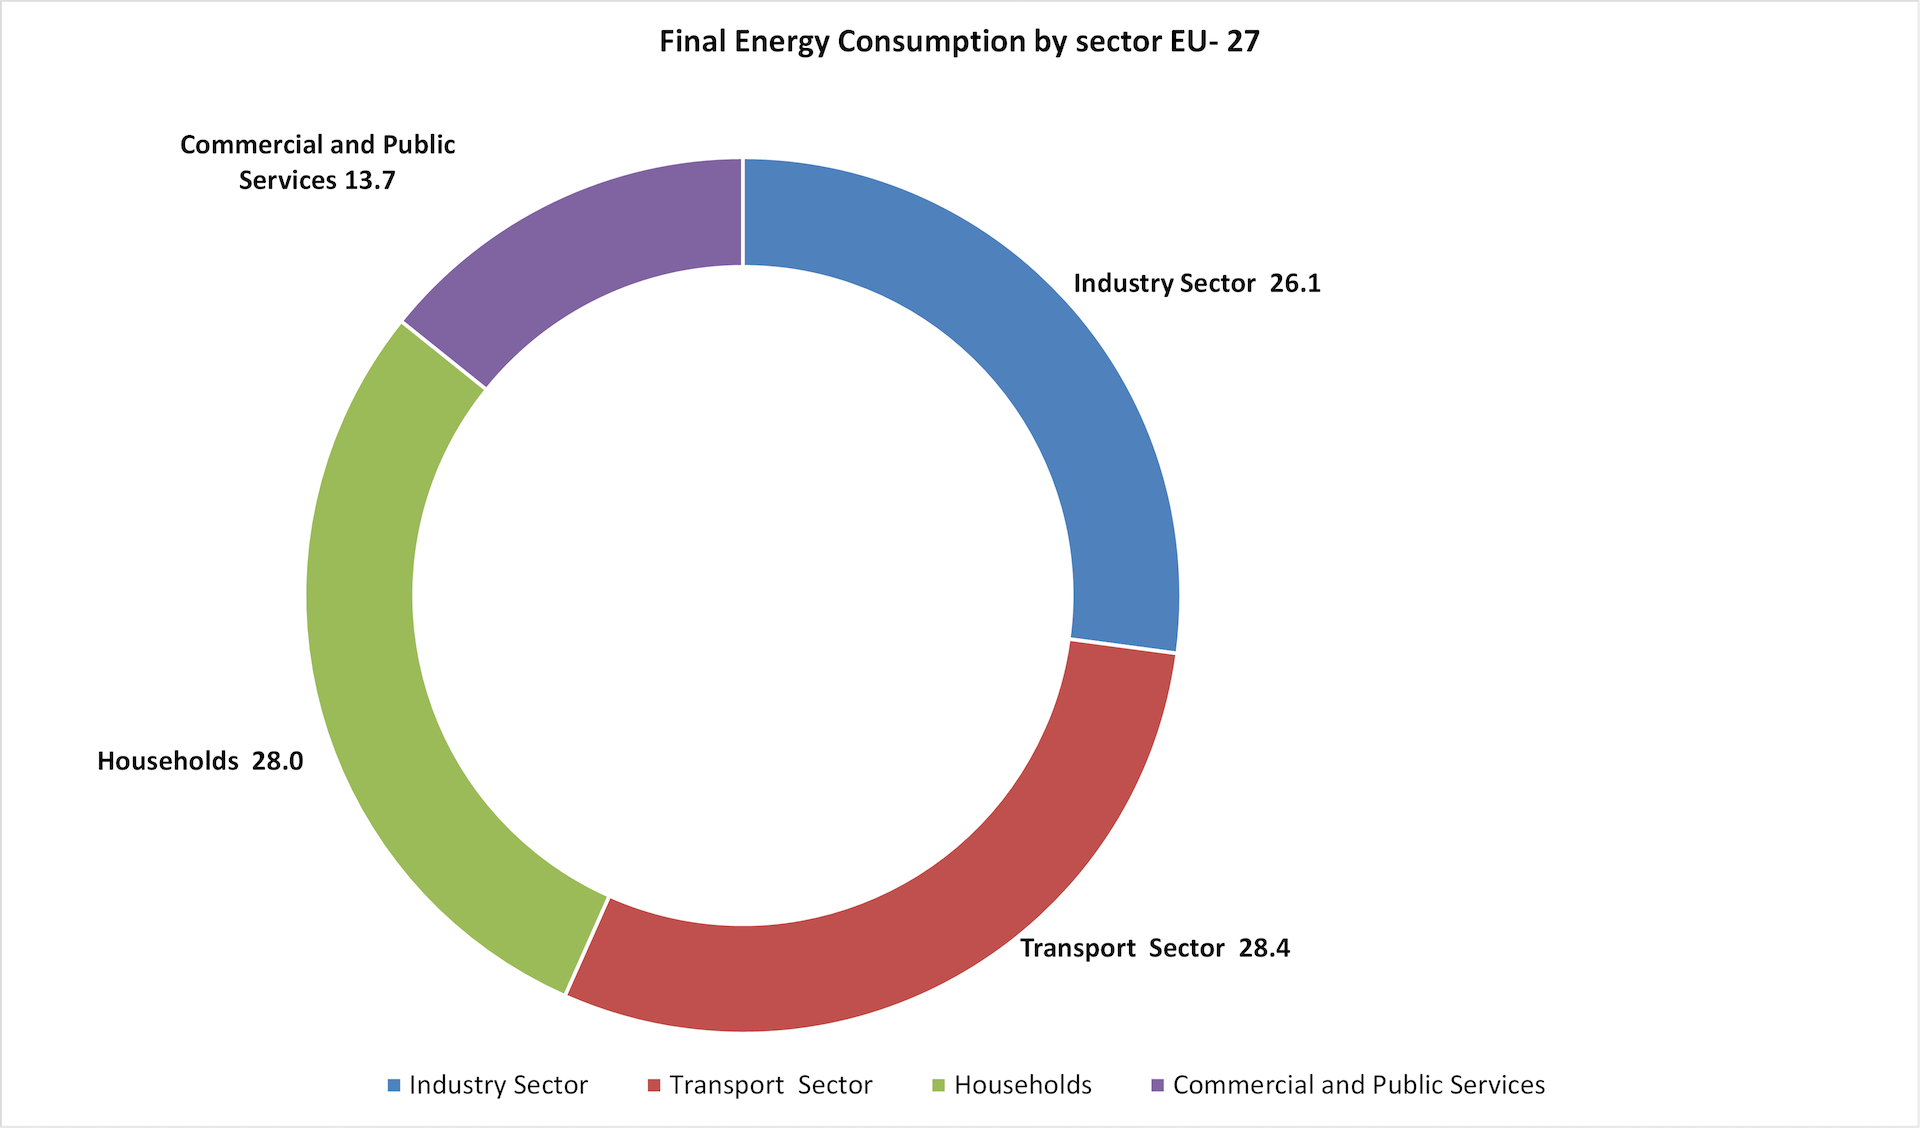
9.10 Final energy consumption by sector in EU27 , 2020 ( % of TOE)
| Industry Sector | Transport Sector | Households | Commercial and Public Services | |
| European Union – 27 countries | 26,1 | 28,4 | 28,0 | 13,7 |
| Belgium | 32,3 | 25,0 | 25,6 | 14,4 |
| Bulgaria | 27,8 | 33,8 | 25,0 | 11,4 |
| Czechia | 27,6 | 26,9 | 30,1 | 12,6 |
| Denmark | 17,5 | 30,0 | 32,9 | 13,9 |
| Germany | 28,0 | 26,3 | 30,0 | 13,8 |
| Estonia | 15,0 | 29,1 | 34,6 | 17,3 |
| Ireland | 20,0 | 32,1 | 28,8 | 16,9 |
| Greece | 17,4 | 35,5 | 29,6 | 13,1 |
| Spain | 26,1 | 36,2 | 20,1 | 13,1 |
| France | 20,1 | 29,8 | 30,2 | 15,9 |
| Croatia | 18,2 | 30,6 | 35,4 | 11,8 |
| Italy | 23,2 | 28,1 | 29,7 | 16,1 |
| Cyprus | 16,0 | 40,4 | 23,8 | 15,7 |
| Latvia | 22,9 | 27,5 | 29,4 | 14,5 |
| Lithuania | 19,4 | 40,2 | 27,1 | 10,9 |
| Luxembourg | 17,9 | 51,1 | 15,2 | 15,1 |
| Hungary | 25,2 | 25,3 | 33,9 | 11,4 |
| Malta | 11,7 | 40,5 | 21,0 | 24,5 |
| Netherlands | 31,0 | 22,0 | 22,0 | 15,3 |
| Austria | 29,5 | 31,1 | 26,9 | 10,4 |
| Poland | 22,7 | 31,0 | 30,0 | 10,8 |
| Portugal | 29,6 | 32,9 | 19,8 | 14,2 |
| Romania | 27,4 | 27,5 | 34,1 | 7,8 |
| Slovenia | 28,4 | 35,7 | 24,2 | 9,4 |
| Slovakia | 32,7 | 25,9 | 28,6 | 11,5 |
| Finland | 44,2 | 16,7 | 22,8 | 12,1 |
| Sweden | 36,8 | 21,0 | 22,9 | 12,7 |
Source: Eurostat

