4.1 Gross investment spending in road infrastructure in selected countries, 2010 - 2014 (at current prices and exchange rates - million Euros)
| Country/Year | 2010 | 2011 | 2012 | 2013 | 2014 |
|---|---|---|---|---|---|
| AT | 390 | 303 | 327 | 363 | 453 |
| BE | 348 | 248 | 553 | 587 | 417 |
| BG | 281 | 344 | 388 | 359 | 253 |
| HR | 515 | 466 | 479 | 424 | 280 |
| CZ | 1720 | 1293 | 876 | 648 | 604 |
| DK | 937 | 1052 | 1324 | – | 1102 |
| EE | 137 | 158 | – | – | 144 |
| FI | 890 | 973 | 1127 | 1115 | 1132 |
| FR | 11942 | 11876 | 12006 | 12093 | 10735 |
| DE | 11240 | 11340 | 11530 | 11730 | 11780 |
| GR | 1394 | 1310 | 1088 | 2181 | .. |
| HU | 840 | 298 | 153 | 401 | 164 |
| IE | 1188 | 850 | 776 | 561 | 638 |
| IT | 3389 | 4129 | 3107 | 2841 | 3860 |
| LV | 99 | 159 | 148 | 150 | 188 |
| LT | 422 | 343 | 243 | 253 | 224 |
| LU | 183 | 222 | 213 | 220 | 205 |
| MT | 40 | 37 | 38 | 32 | 39 |
| NL | 2300 | 2287 | – | – | .. |
| PL | 6510 | 8319 | 4382 | 2465 | 1721 |
| PT | 1511 | – | 274 | 211 | .. |
| RO | 2850 | 3283 | 3092 | 2729 | 2493 |
| SK | 342 | 432 | 311 | 360 | 550 |
| SI | 221 | 112 | 102 | 104 | 139 |
| ES | 7851 | 5966 | 5362 | 4651 | 4266 |
| SE | 1668 | 1911 | 2213 | 2013 | 1864 |
| UK | 6478 | 5557 | 5544 | 6166 | 7726 |
| ME | 18 | 15 | 18 | 20 | 9 |
| MK | 32 | 38 | – | – | .. |
| RS | 227 | 339 | 255 | 280 | 337 |
| TR | 5419 | 5181 | 4799 | 4880 | 4803 |
| IS | 79 | 39 | 38 | 42 | 45 |
| NO | 2675 | 2812 | 3301 | 3844 | 3804 |
| CH | 3423 | 3827 | 3880 | 3731 | .. |
Source: ITF, OECD
Note: the data coverage varies significantly from a country to another, mainly due to the lack of more detailed common definitions and the difficulty for countries to change their data collection system.
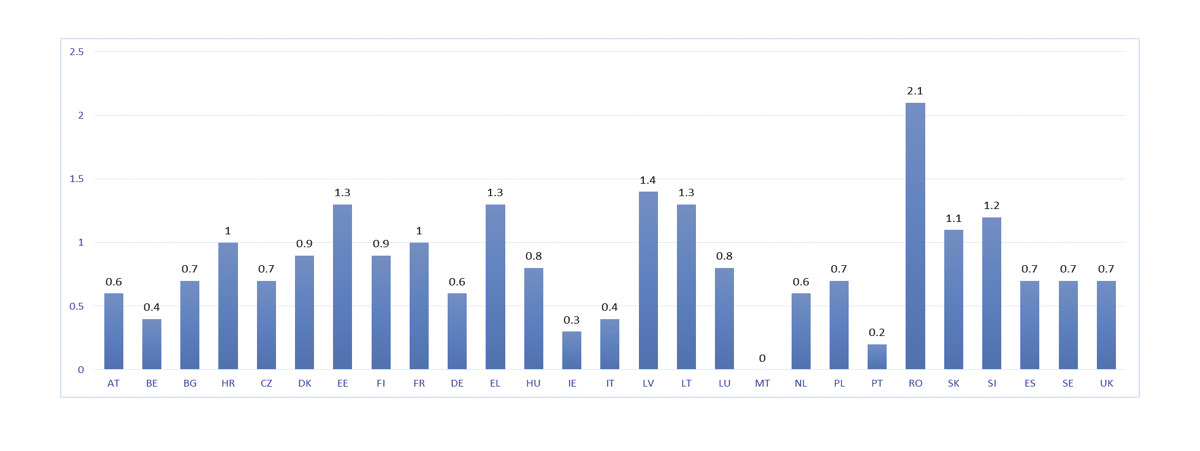
4.2 Investment in inland transport infrastructure in EU 28, 2014 (as a percentage of GDP, at current prices)
Source: ITF at the OECD
Note: No data fo CY
4.3 Maintenance expenditures in road infrastructure in selected countries, 2010-2014 (at current prices and exchange rates - million Euros)
| GEO/TIME | 2010 | 2011 | 2012 | 2013 | 2014 |
|---|---|---|---|---|---|
| AT | 559 | 494 | 517 | 559 | 667 |
| BE | 184 | 156 | 145 | 147 | 206 |
| BG | 100 | 71 | 103 | 96 | 93 |
| HR | 195 | 212 | 187 | 209 | 257 |
| CZ | 670 | 570 | 571 | 513 | 587 |
| DK | 1.058 | 881 | 945 | 920 | 796 |
| EE | 38 | 39 | 44 | 47 | 45 |
| FI | 667 | 658 | 574 | 585 | 506 |
| FR | 2.431 | 2.746 | 2.851 | 2.904 | 2.760 |
| HU | 328 | 256 | 296 | 412 | 357 |
| IE | 164 | 161 | 139 | 128 | 85 |
| IT | 6.437 | 6.220 | 7.195 | 9.134 | 9.564 |
| LV | 85 | 90 | 93 | 100 | 154 |
| LT | 160 | 153 | 123 | 127 | 143 |
| LU | 34 | 37 | 34 | 41 | 41 |
| MT | 25 | 27 | 24 | 25 | 17 |
| NL | 1.209 | 323 | .. | ||
| PL | 2.636 | 2.678 | 428 | 438 | 383 |
| PT | 102 | 165 | 174 | .. | |
| RO | .. | ||||
| SK | 175 | 160 | 193 | 204 | 181 |
| SI | 137 | 122 | 120 | 123 | 118 |
| SE | 875 | 856 | 959 | 1.044 | 1.017 |
| UK | 3.919 | 3.552 | 3.591 | 3.346 | 3229,13 |
| Total EU | 22.188 | 20.462 | 19.295 | 21.276 | 21206,29 |
| MK | 16 | 15 | .. | ||
| RS | 228 | 205 | 208 | 129 | 142,98 |
| TR | 360 | 674 | 600 | 630 | 582,14 |
| IS | 29 | 29 | 29 | 28 | 32 |
| NO | 1.361 | 1.615 | 1.747 | 1.841 | 1997,63 |
| CH | 2.001 | 2.238 | 2.414 | 2.402 | .. |
Source: ITF
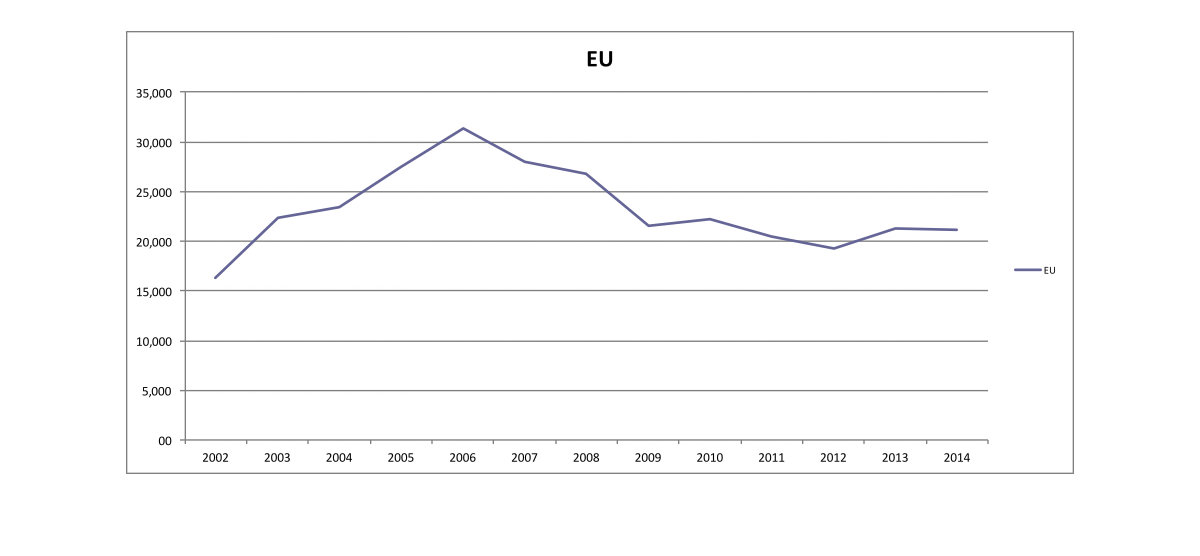
4.4 Maintenance expenditures in road infrastructure in selected countries, 2002 - 2014 (million Euros)
| 2002 | 2003 | 2004 | 2005 | 2006 | 2007 | 2008 | 2009 | 2010 | 2011 | 2012 | 2013 | 2014 | ||
|---|---|---|---|---|---|---|---|---|---|---|---|---|---|---|
| EU | 16275,6 | 22325,6 | 23471,6 | 27430,1 | 31301,8 | 27960,3 | 26791,6 | 21536,9 | 22188,4 | 20462,4 | 19295,1 | 21275,6 | 21206,3 | 1000000 |
Source: ITF
Note: No data for CY


