2.1 Length of total road network by category(*) by country, end of 2020* (km)
| Motorways | Main or National Roads | Secondary or regional roads | Other roads** | Total | |
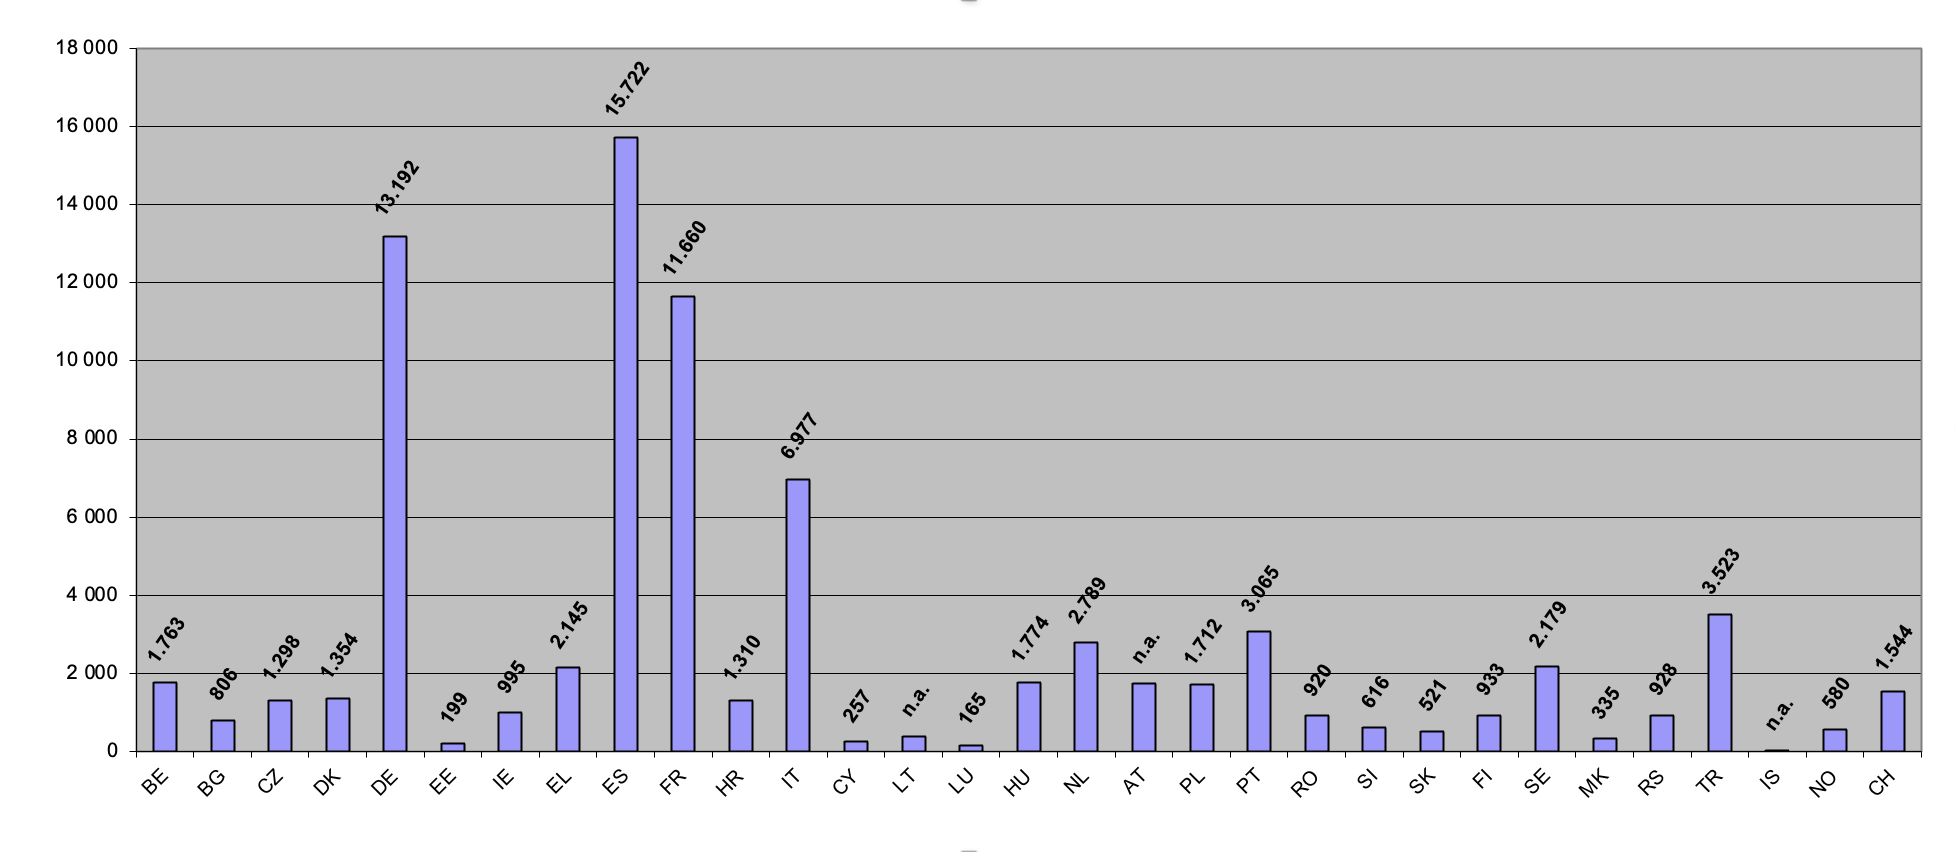
| BE | 1763 | 13 229 | 1349 | 138 869 | 155 210 |
| BG | 806 | 2883 | 4019 | 12 209 | 19 917 |
| CZ | 1298 | 5808 | 48 685 | 74 919 | 130 710 |
| DK | 1 354 | 2 606 | 70 975 | 74 935 | |
| DE | 13 192 | 37 826 | 178 703 | — | 229 721 |
| EE | 199 | 3 811 | 12 655 | 42 181 | 58 846 |
| IE | 995 | 4 314 | 13 120 | 80 548 | 98 977 |
| EL | 2 145 | 9 299 | 30 864 | 75 600 | 117 908 |
| ES | 15 722 | 14 920 | 134 827 | 501 053 | 666 522 |
| FR | 11 660 | 9 698 | 378 834 | 704 999 | 1 105 191 |
| HR | 1 310 | 7 137 | 9 456 | 8 846 | 26 749 |
| IT | 6 977 | 23 305 | 137 283 | 67 927 | 235 492 |
| CY | 257 | 5 461 | 2 431 | 4 990 | 13 139 |
| LT | 400 | 6 679 | 14 559 | 50 982 | 72 620 |
| LU | 165 | 839 | 1 891 | 19 | 2 914 |
| HU | 1 774 | 30 621 | 183 155 | 215 550 | |
| MT | — | 520 | 2 120 | 2 640 | |
| NL | 2 789 | 2 714 | 7 817 | 128 041 | 141 361 |
| AT | 1 749 | 10 762 | 23 555 | 91 916 | 127 982 |
| PL | 1 712 | 17 765 | 153 586 | 257 204 | 430 267 |
| PT | 3 065 | 6 469 | 4 791 | — | 14 325 |
| RO | 920 | 16 993 | 35 085 | 33 793 | 86 791 |
| SI | 616 | 5 925 | 32 143 | 38 684 | |
| SK | 521 | 3 634 | 13 975 | 39 671 | 57 801 |
| FI | 933 | 12 518 | 13 484 | 50 973 | 77 908 |
| SE | 2 179 | 13 499 | 136 964 | 43 008 | 195 650 |
| ME | — | 8 412 | 8 412 | ||
| MK | 335 | 897 | 3 794 | 9 786 | 14 812 |
| RS | 928 | 3 865 | 9 662 | 30 453 | 44 908 |
| TR | 3 523 | 30 974 | 34 136 | 187 695 | 256 328 |
| IS | 41 | 4 370 | 3 380 | 5 158 | 12 949 |
| NO | 580 | 10 489 | 44 701 | 39 480 | 95 250 |
| CH | 1 544 | 710 | 17 278 | 63 742 | 83 274 |
Source: Eurostat [road_if_roadsc], International Road Federation (www.irfnet.ch) (BE, EL, LU, MT, IS), national statistics
Notes:
*BE end of 2015; EL: 2018; IT, ES end of 2019; LU: 2018 (other roads); for MT end of 2017;
CY: other road network includes forest gravel roads
**: the definition of road types varies from country to country, the data are therefore not fully comparable. MT, CY: data for 2016
“Other roads” sometimes includes roads without a hard surface.
2.2 Length of total road network by country, 2020 (km)
Notes:
“Other roads” sometimes includes roads without a hard surface.
BE end of 2015
EL end of 2018
IT, ES end of 2019
MT end of 2017
2.3 Density of the total road network in EU countries, 2020 (km road/ km² land area)
Source: EC
Notes:
BE end of 2015
EL end of 2018
IT, ES end of 2019
MT end of 2017
2.4 Length of motorway network in EU countries, 2020 (km)
Notes:
BE end of 2015
EL end of 2018
IT, ES end of 2019
MT end of 2017
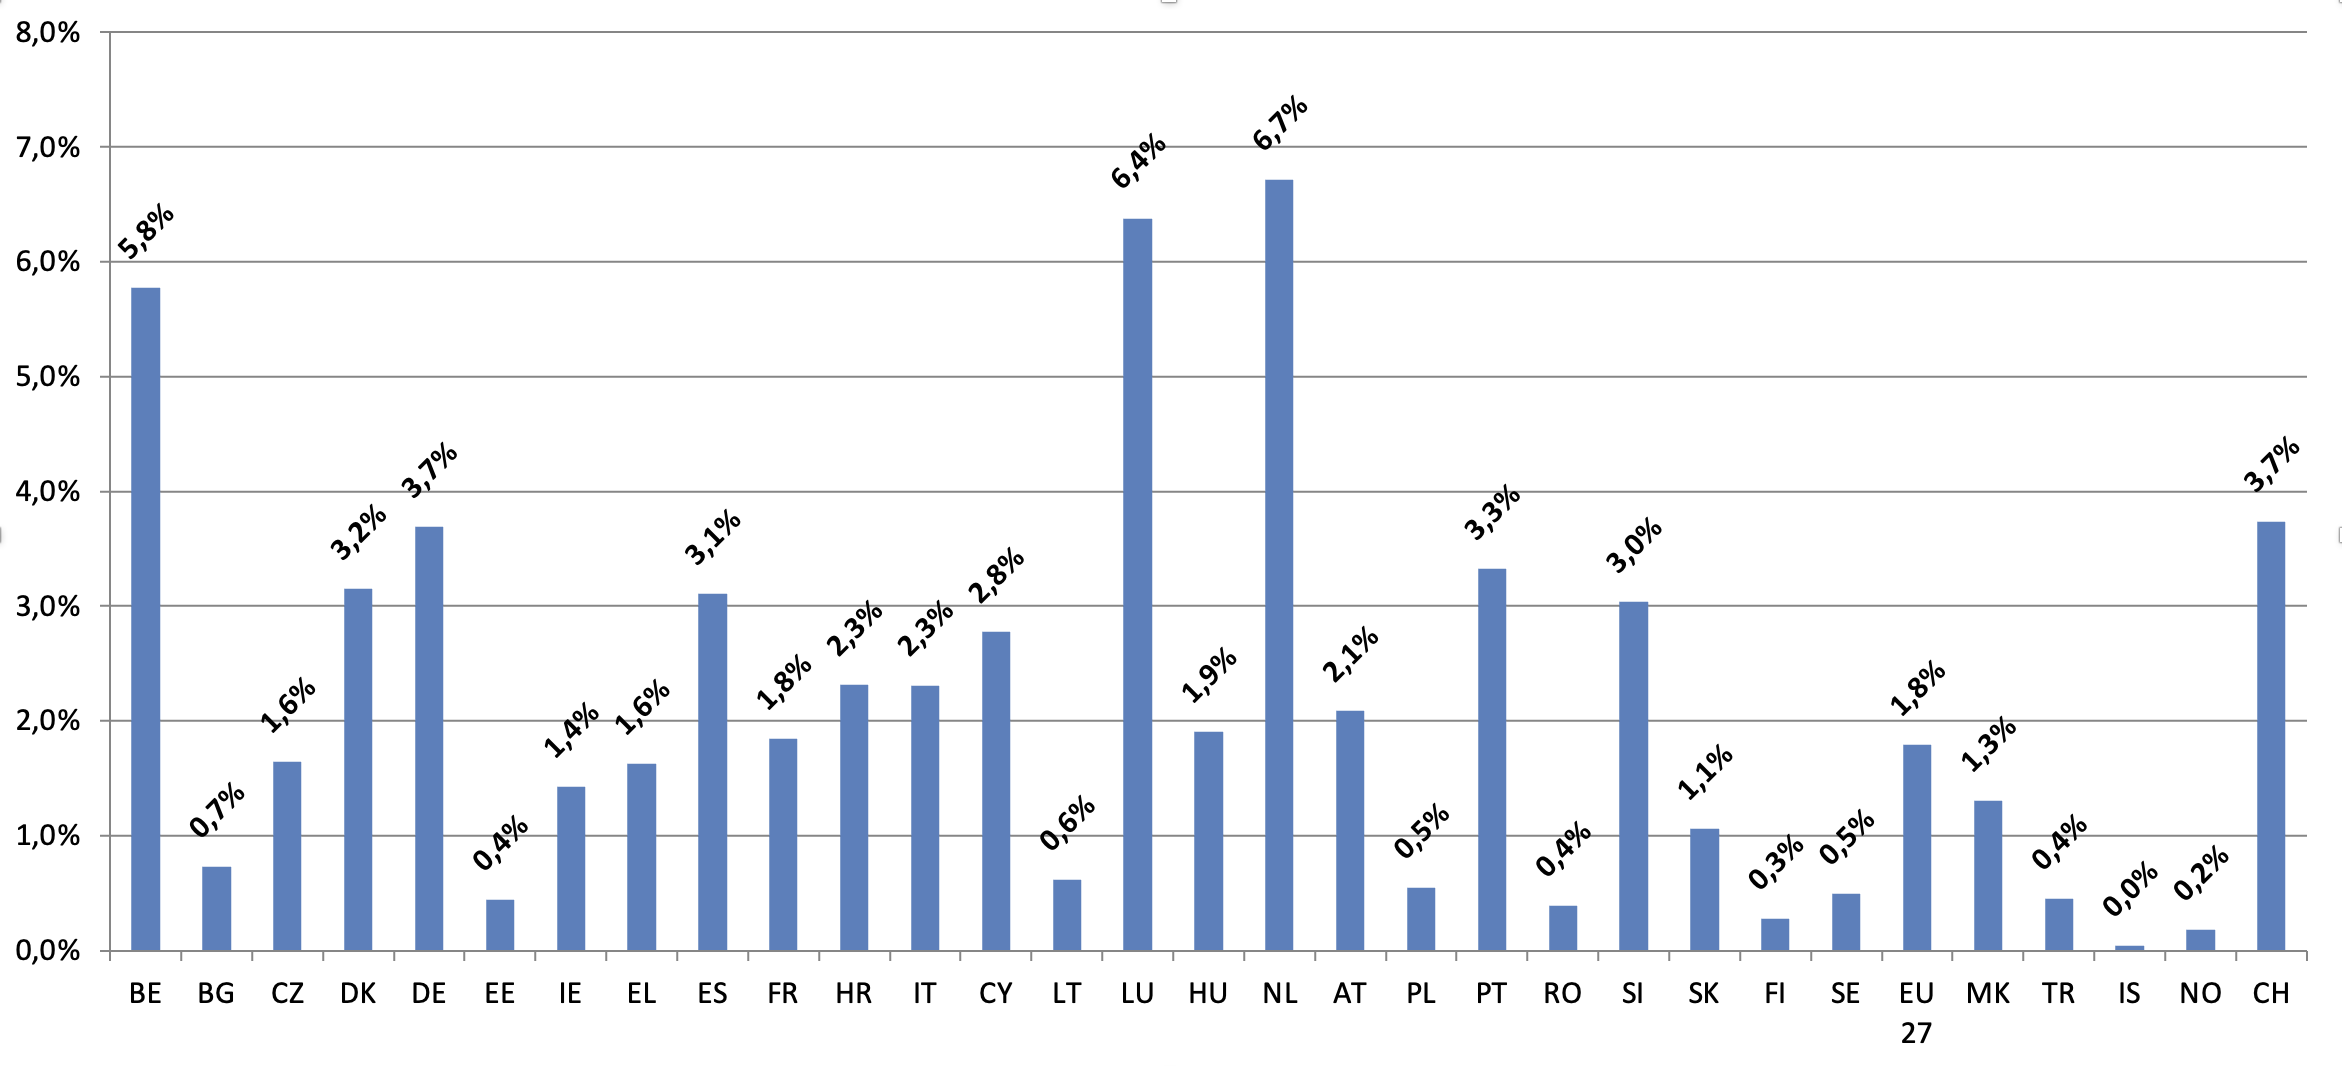
2.5 Proportion of motorways compared to the total road network in EU countries, 2020 (%)
Source: EC
Notes:
BE end of 2015
EL end of 2018
IT, ES end of 2019
MT end of 2017
2.6 Density of motorways in EU countries, 2020 (km motorway per 100 km² land area)
Source: Eurostat, EC
BE end of 2015
EL end of 2018
IT, ES end of 2019
MT end of 2017
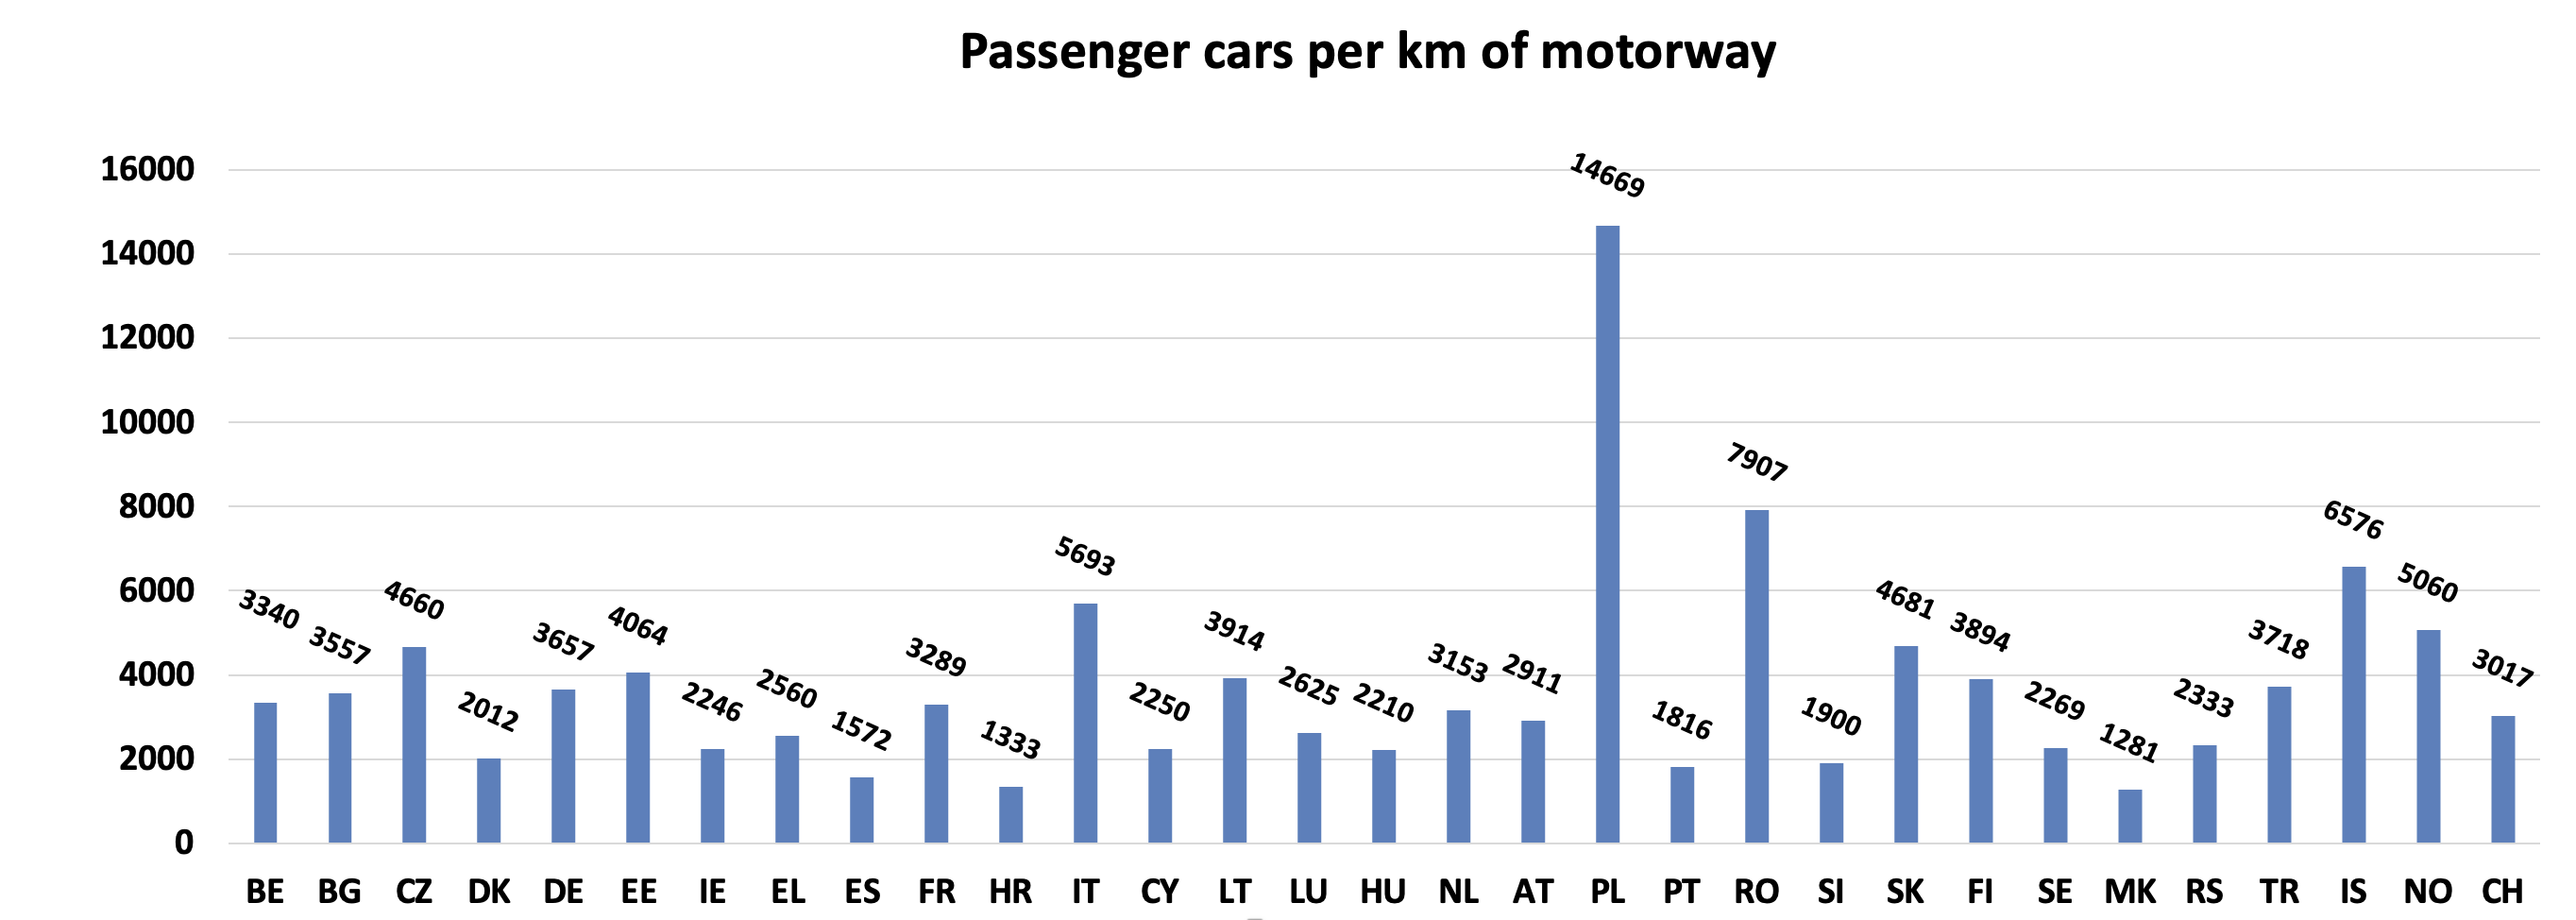
2.7 Passenger cars per km of motorway in EU countries, 2020
Stock at end of year, except for BE: 1 August (1 July in 2012), CH: 30 September.
Taxis are usually included.
HR: from 2009 light vans are included in passenger cars and no longer in goods vehicles
FR: provisional data for 2020
2.8 Transport network Comparison between EU 27, USA, Japan, Russia and China, 2020 (thousand km)
| EU 27 | USA (1) | Japan (2) | China(4) | Russia(3) | |
| Road network (paved) |
4.467,0 | 4.577 | 1.012 | 4.945 | 1.189 |
| Motorway network | 74,5 | 92,8 | 9,2 | 161,0 | 57,0 |
| Railway network | 200,1 | 196,6 | 18,9 | 146,3 | 85,5 |
| Electrified rail lines | 113,3 | – | 11,7 | 100,4 | 44,0 |
Source: Chapter 2.5, 2.6 and 2.7, International Transport Forum (fatalities data for JP, RU all data) , Union Internationale des Chemins de Fer (JP, CN), national statistics (CN, JP, US)
Notes:
(1): Divided highways with 4 or more lanes (rural or urban interstate, freeways, expressways, arterial and collector) with full access control by the authorities. For the railways data:a sum of partly overlapping networks.
(2): Japan: national expressways.2019 data.
(3): RU: roads of federal importance. 2019 data
(4): China: both oil and gas pipelines
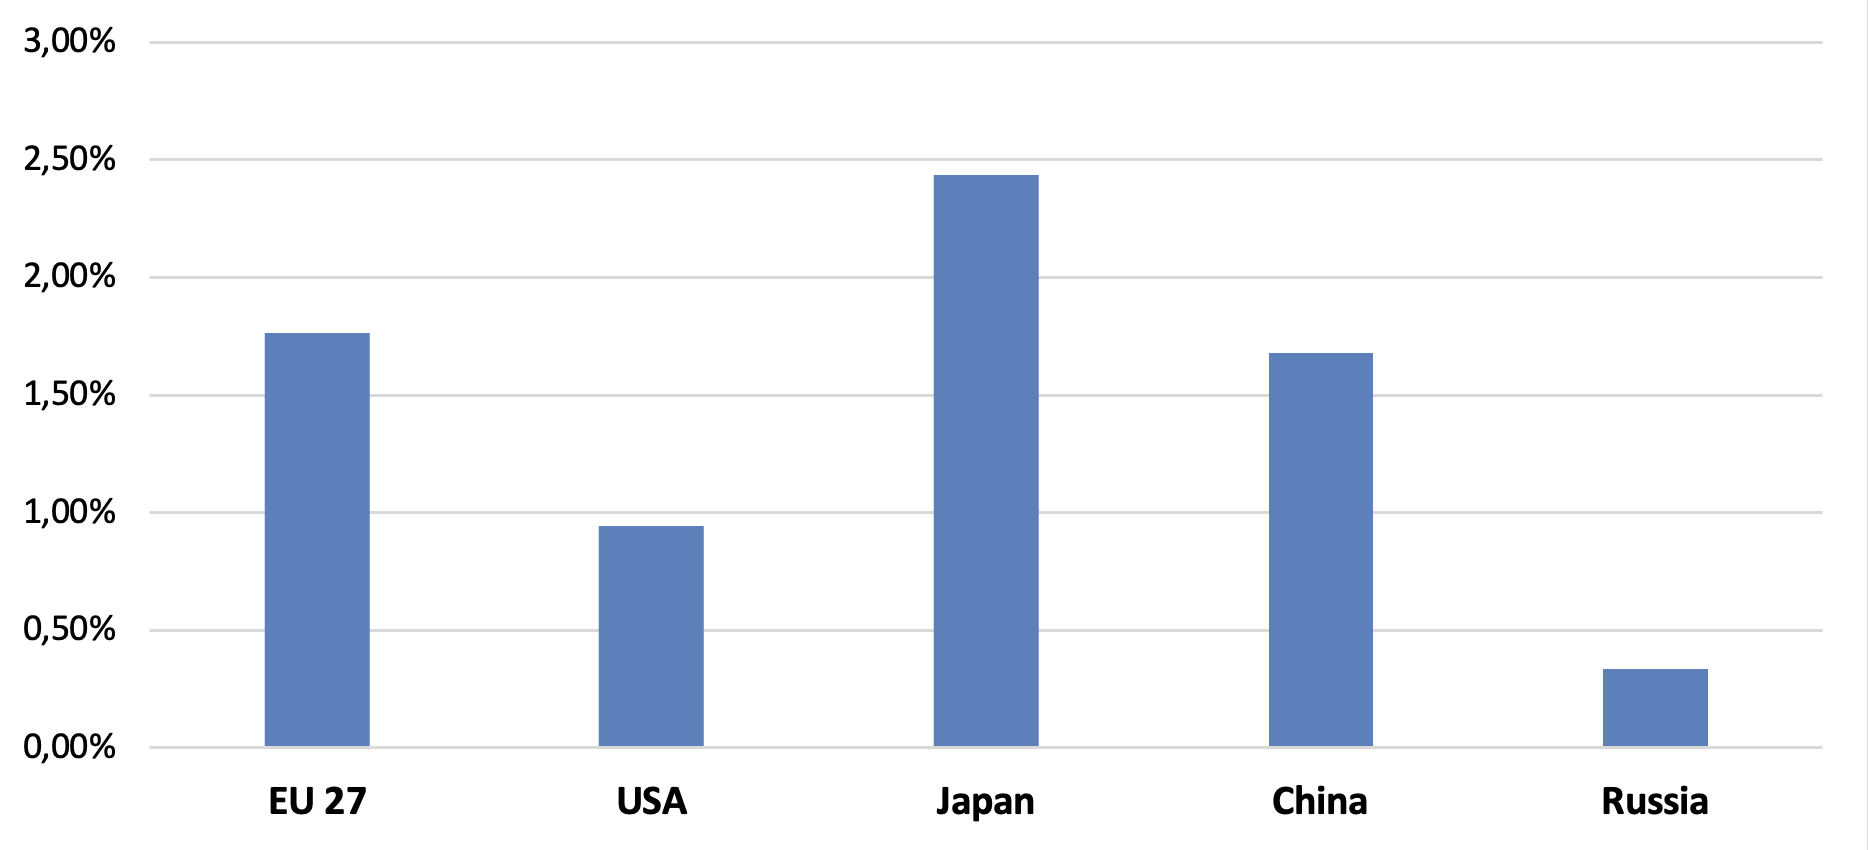
2.9 Density of motorways Comparison between EU 27, USA, Japan, Russia and China, 2020 (km motorway per km² land area)
Source: EC
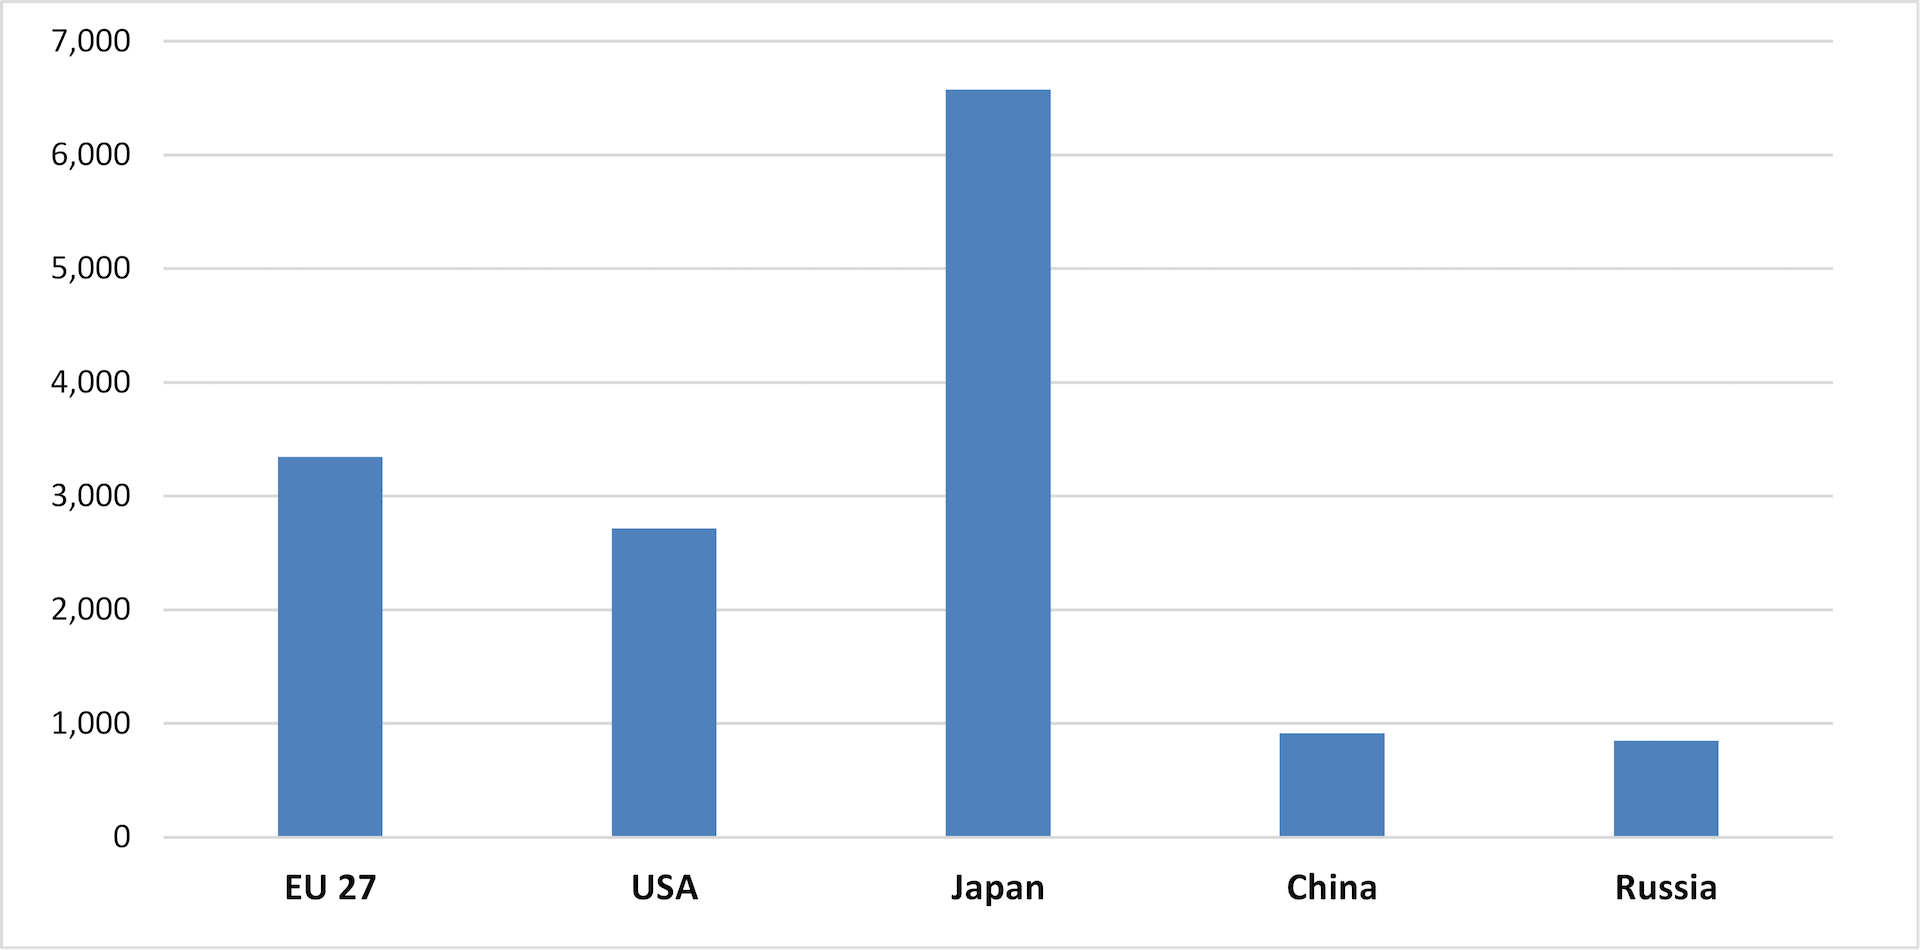
2.10 Passenger cars per km of motorway. Comparison between EU 27, USA, Japan, Russia and China, 2020
Source: Eurostat, International Road Federation, International Transport Forum, Union Internationale des Chemins de Fer, national statistics
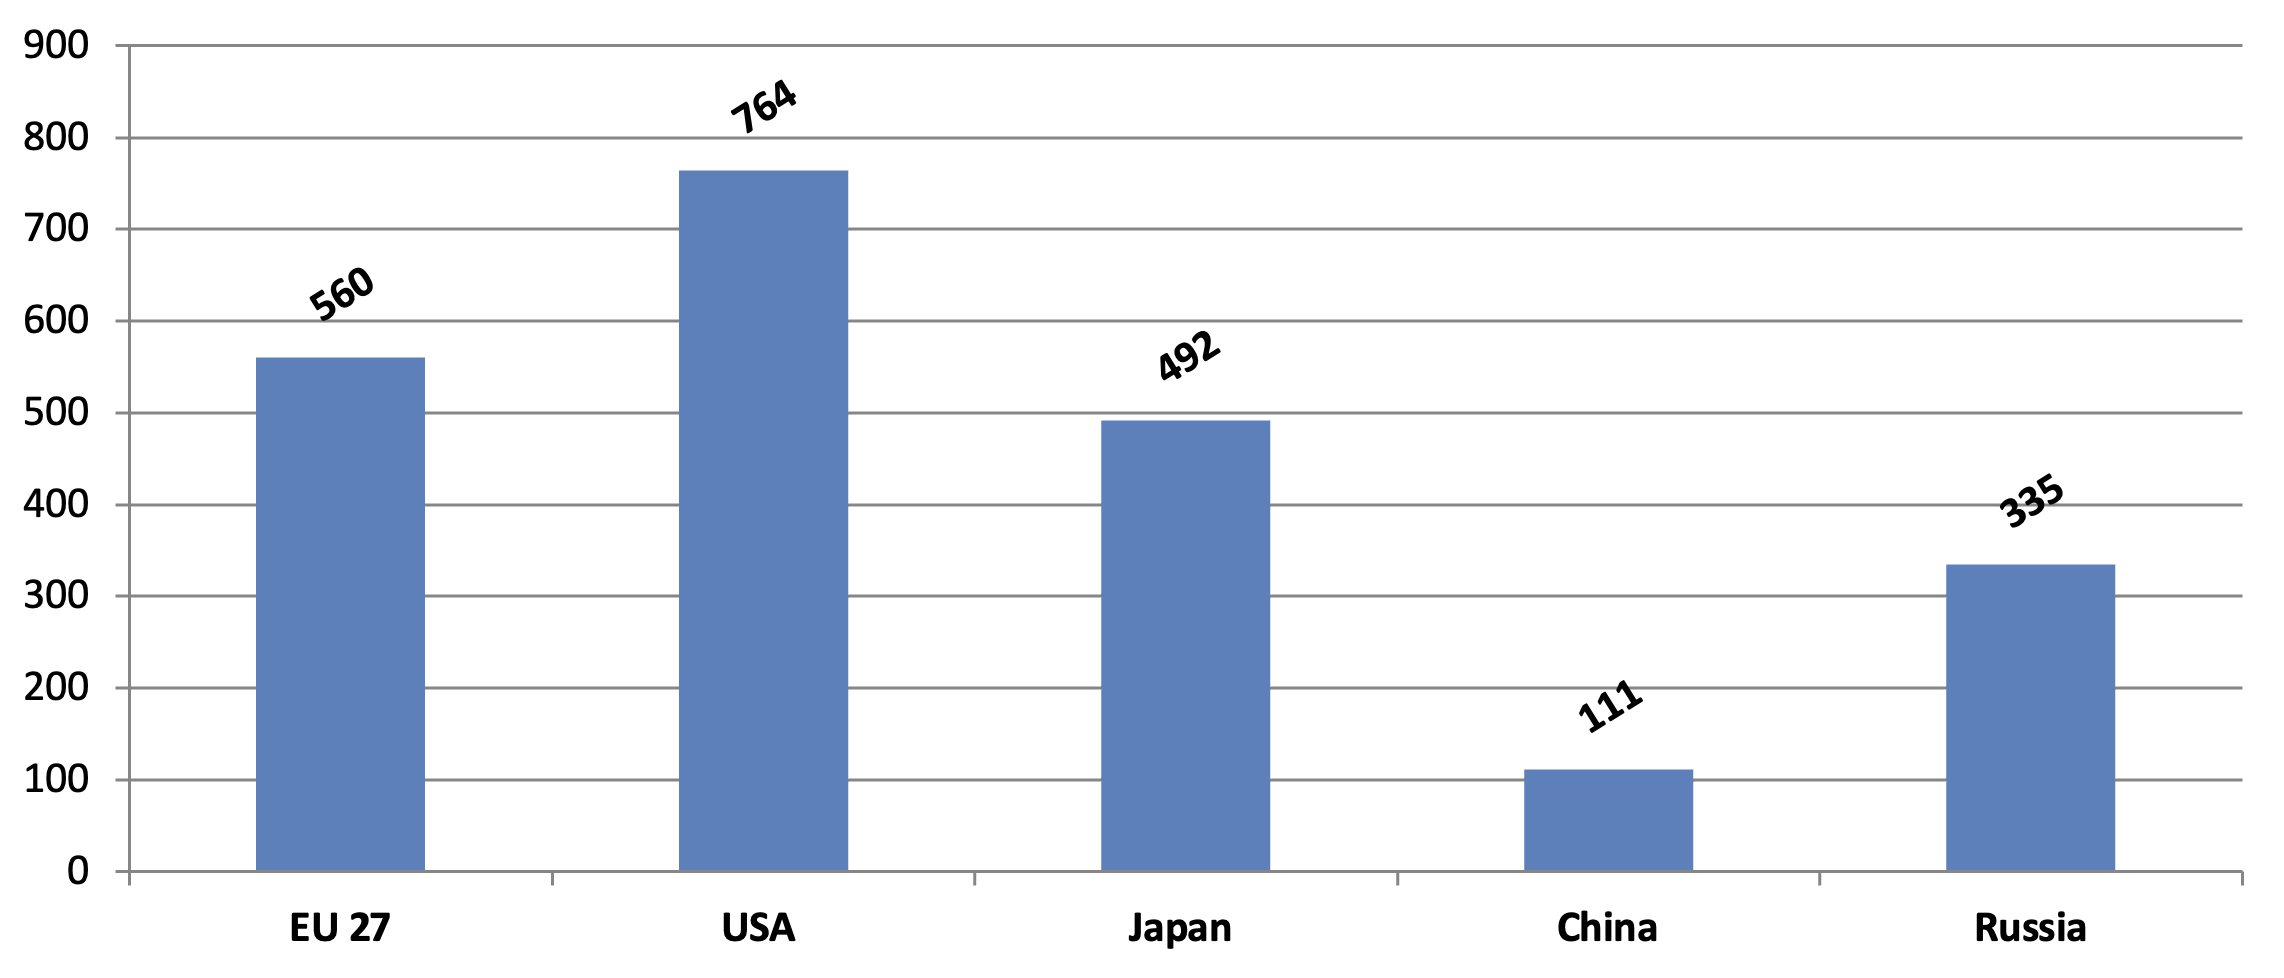
2.11 Cars/1000 person in EU 27, USA, Japan, Russia and China, 2020
Source: EC


