5.1 Transport of goods, performance by mode in EU 28, 1995-2014 (billion tkm)
| Road | Rail | Inland Water- ways | Pipe- lines | Sea(1) | Air | Total | ||
|---|---|---|---|---|---|---|---|---|
| 1995 | 1 289 | 388 | 122 | 115 | 930 | 2 | 2845, 948 | |
| 1996 | 1 303 | 394 | 120 | 119 | 942 | 2 | 2879, 110 | |
| 1997 | 1 352 | 411 | 128 | 119 | 969 | 2 | 2980, 161 | |
| 1998 | 1 414 | 394 | 131 | 126 | 1 000 | 2 | 3068, 126 | |
| 1999 | 1 461 | 385 | 129 | 125 | 1 029 | 2 | 3131, 013 | used for section 5.3 |
| 2000 | 1 509 | 405 | 134 | 127 | 1 067 | 2 | 3244, 912 | 2 176 |
| 2001 | 1 553 | 388 | 133 | 134 | 1 083 | 2 | 3292, 283 | 2 207 |
| 2002 | 1 603 | 386 | 133 | 130 | 1 100 | 2 | 3353, 314 | 2 251 |
| 2003 | 1 608 | 394 | 124 | 132 | 1 119 | 2 | 3378, 221 | 2 257 |
| 2004 | 1 751 | 419 | 137 | 133 | 1 159 | 2 | 3601, 139 | 2 440 |
| 2005 | 1 795 | 416 | 139 | 138 | 1 178 | 2 | 3667, 082 | 2 487 |
| 2006 | 1 858 | 438 | 139 | 137 | 1 191 | 2 | 3764, 233 | 2 571 |
| 2007 | 1 925 | 452 | 145 | 128 | 1 174 | 2 | 3826, 497 | 2 650 |
| 2008 | 1 891 | 443 | 146 | 125 | 1 153 | 2 | 3760, 470 | 2 605 |
| 2009 | 1 700 | 364 | 131 | 122 | 1 035 | 2 | 3353, 069 | 2 316 |
| 2010 | 1 755 | 394 | 156 | 121 | 1 094 | 2 | 3522, 114 | 2 425 |
| 2011 | 1 744 | 422 | 142 | 118 | 1 111 | 2 | 3539, 859 | 2 426 |
| 2012 | 1 693 | 407 | 150 | 115 | 1 085 | 2 | 3451, 158 | 2 364 |
| 2013 | 1 719 | 406 | 153 | 112 | 1 082 | 2 | 3474, 050 | 2 390 |
| 2014 | 1 725 | 411 | 151 | 113 | 1 122 | 2 | 3524, 416 | 2 400 |
| 1995 -2014 | 33,9% | 5,8% | 23,5% | -1,8% | 20,6% | 27,0% | 23,8% | |
| 2013-2014 | 0,4% | 1,1% | -1,2% | 1,0% | 3,8% | 0,0% | 1,4% |
Source: EC
Air and Sea: only domestic and intra-EU-28 transport; estimates for air and for sea (1995-2004)
Road: national and international haulage by vehicles registered in the EU-28.
(1) The time series for maritime transport performance has been revised, for the period from 2005 to 2014, by replacing previous estimates on port-to port distances with more accurate measurements by Eurostat. The time series from 1995 to 2004 has been recalibrated by DG MOVE in line with the new Eurostat figures to avoid break in series. The revision of tkm figures mainly concerns the calculation of distance travelled and not the tonnages transported by sea.
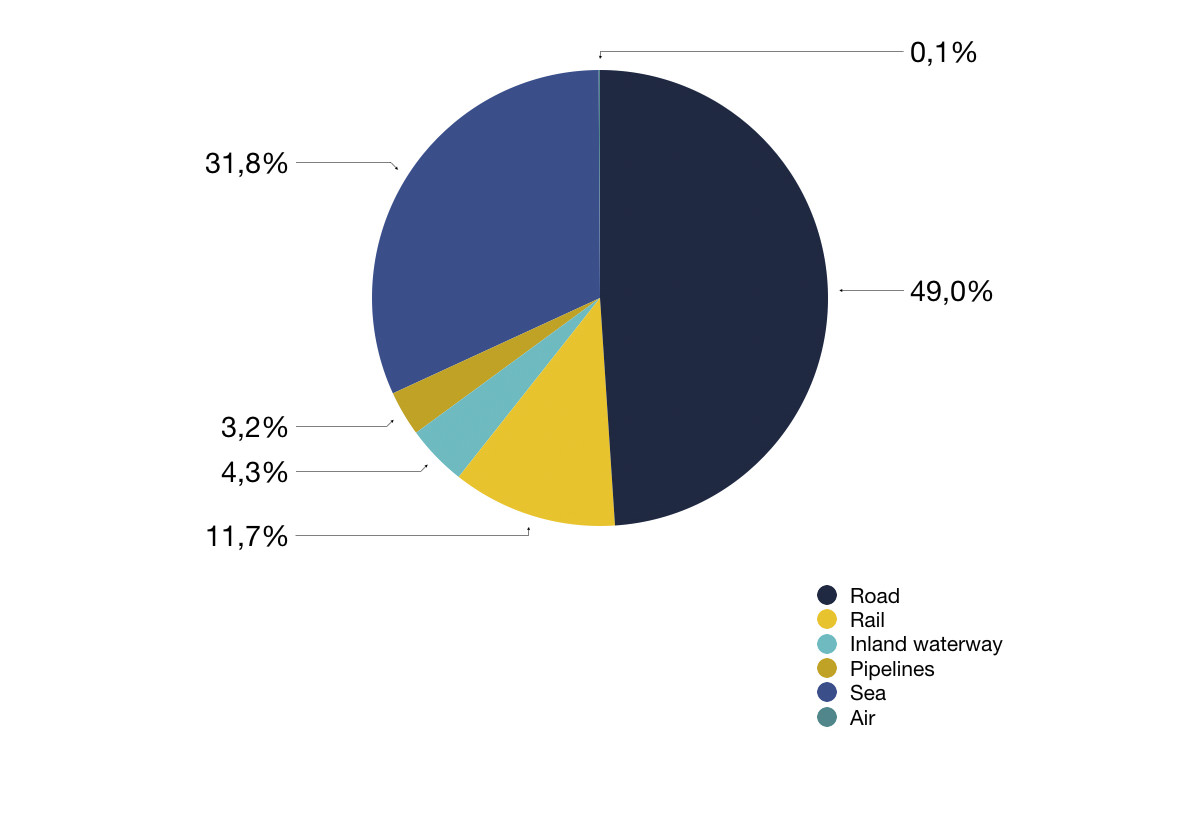
5.2 Goods transport by mode in EU 28, 2014 (% of tkm)
Source: EC
Notes:
Air and Sea: only domestic and intra-EU-27 transport; provisional estimates
Road: national and international haulage by vehicles registered in the EU-28
5.3 Inland transport modal split in EU 28, 2000-2014 (% of tkm)
| Road | Rail | Inland waterways | Pipelines | |
|---|---|---|---|---|
| 2000 | 69,4 | 18,6 | 6,2 | 5,8 |
| 2001 | 70,3 | 17,6 | 6,0 | 6,1 |
| 2002 | 71,2 | 17,1 | 5,9 | 5,8 |
| 2003 | 71,2 | 17,5 | 5,5 | 5,8 |
| 2004 | 71,7 | 17,2 | 5,6 | 5,5 |
| 2005 | 72,2 | 16,7 | 5,6 | 5,5 |
| 2006 | 72,3 | 17,0 | 5,4 | 5,3 |
| 2007 | 72,6 | 17,1 | 5,5 | 4,8 |
| 2008 | 72,6 | 17,0 | 5,6 | 4,8 |
| 2009 | 73,4 | 15,7 | 5,6 | 5,3 |
| 2010 | 72,4 | 16,2 | 6,4 | 5,0 |
| 2011 | 71,9 | 17,4 | 5,9 | 4,9 |
| 2012 | 71,6 | 17,2 | 6,3 | 4,9 |
| 2013 | 71,9 | 17,0 | 6,4 | 4,7 |
| 2014 | 71,9 | 17,1 | 6,3 | 4,7 |
| 2000-2014 | 3,6 | -8,1 | 2,1 | -19,5 |
Source: EC
Notes:
Road: national and international haulage by vehicles registered in the EU-28
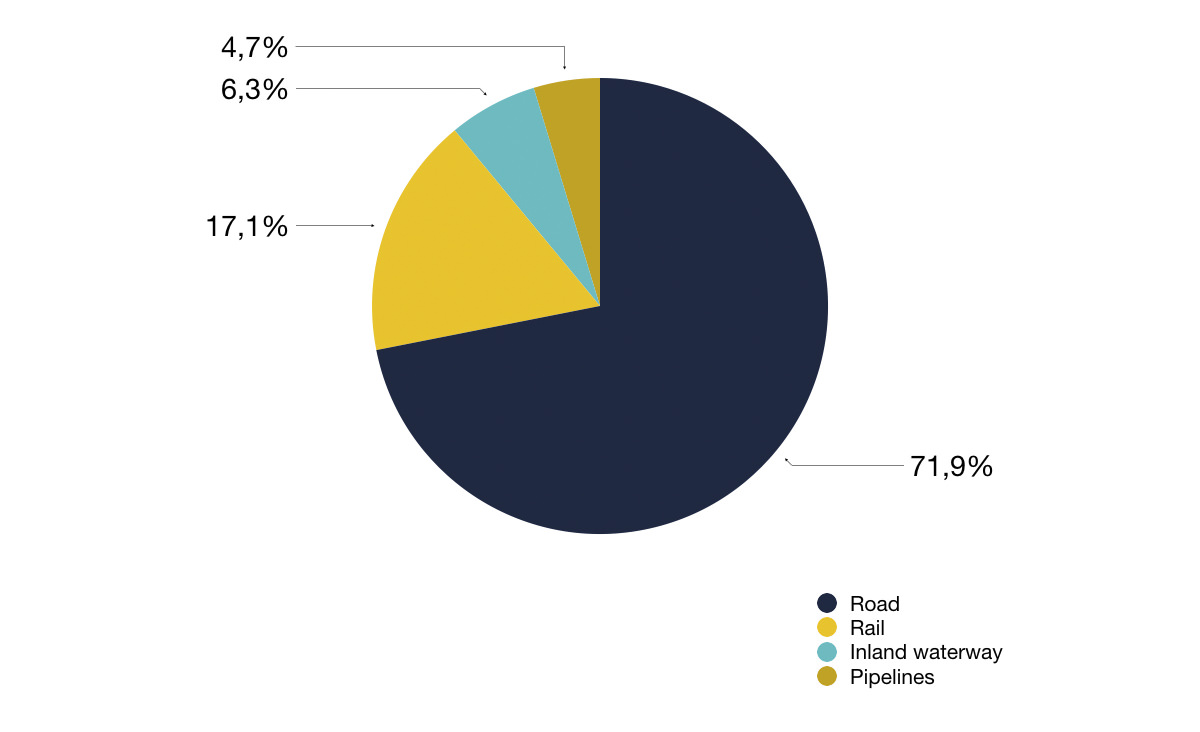
5.4 Inland transport modal split in EU 28, 2014 (% of tkm)
Source: EC
Notes:
Road: national and international haulage by vehicles registered in the EU-28
5.5 Performance of inland freight transport by mode in EU countries, 2014 (billion tkm)
| Road (*) | Railways | Inland Waterways (**) | Pipelines (Oil) (***) | |
|---|---|---|---|---|
| EU-28 | 1725, 50 | 410, 80 | 150, 90 | 112, 90 |
| BE | 31,8 | 7,3 | 10,5 | 1,6 |
| BG | 27,9 | 3,4 | 5,1 | 0,6 |
| CZ | 54,1 | 14,6 | 0,0 | 2,1 |
| DK | 16,2 | 2,5 | – | 2,4 |
| DE | 310,1 | 112,6 | 59,1 | 17,5 |
| EE | 6,3 | 3,3 | – | – |
| IE | 9,8 | 0,1 | – | – |
| EL | 19,2 | 0,3 | – | 0,2 |
| ES | 195,8 | 10,8 | – | 9,0 |
| FR | 165,2 | 32,2 | 8,8 | 11,1 |
| HR | 9,4 | 2,1 | 0,7 | 1,1 |
| IT | 117,8 | 20,1 | 0,1 | 9,6 |
| CY | 0,5 | – | – | – |
| LV | 13,7 | 19,4 | – | 2,4 |
| LT | 28,1 | 14,3 | 0,0 | 0,6 |
| LU | 9,6 | 0,2 | 0,3 | – |
| HU | 37,5 | 10,2 | 1,8 | 2,8 |
| MT | 0,3 | – | – | – |
| NL | 70,9 | 6,2 | 49,3 | 5,8 |
| AT | 24,3 | 20,5 | 2,2 | 8,3 |
| PL | 250,9 | 50,1 | 0,1 | 22,1 |
| PT | 34,9 | 2,4 | – | 0,4 |
| RO | 35,1 | 12,3 | 11,8 | 1,0 |
| SI | 16,3 | 4,1 | – | – |
| SK | 31,4 | 8,8 | 0,9 | 4,5 |
| FI | 23,4 | 9,6 | 0,1 | – |
| SE | 42,0 | 21,3 | – | – |
| UK | 143,2 | 22,1 | 0,2 | 10,0 |
Source: EC
(*) National and international haulage by vehicles registered in the reporting country (including cross-trade and cabotage). Only haulage of heavy goods vehicles (usually > 3,5 tonnes load capacity)
(**) For FI only shipborne transport (i.e. no floating)
(***) Data are not harmonised and therefore not fully comparable; in most countries, only pipelines longer than 40km are included. DE: only crude oil (i.e. no refined petroleum products)
5.6 Registration of commercial vehicles in EU and selected countries, 2015-2016
| Light Commercial Vehicles (LCV) Up to 3,5 t | |||
|---|---|---|---|
| Country | 2015 | 2016 | Evolution 2015-2016 |
| AT | 32.852 | 35.906 | 9,3% |
| BE | 63.856 | 70.849 | 11,0% |
| DK | 4.875 | 4.552 | -6,6% |
| HR | 6.843 | 8.316 | 21,5% |
| CZ | 17.272 | 19.236 | 11,4% |
| DK | 32.456 | 36.624 | 12,8% |
| EE | 3.897 | 4.353 | 11,7% |
| FI | 11.522 | 13.678 | 18,7% |
| FR | 377.741 | 408.545 | 8,2% |
| DE | 237.922 | 258.119 | 8,5% |
| EL | 5.652 | 5.623 | -0,5% |
| HU | 17.516 | 21.335 | 21,8% |
| IE | 23.403 | 27.514 | 17,6% |
| IT | 133.680 | 199.534 | 49,3% |
| LV | 2.348 | 2.218 | -5,5% |
| LT | 2.369 | 2.791 | 17,8% |
| LU | 3.949 | 4.593 | 16,3% |
| NL | 57.376 | 70.025 | 22,0% |
| PL | 50.307 | 56.926 | 13,2% |
| PT | 30.858 | 34.862 | 13,0% |
| RO | 11.356 | 14.372 | 26,6% |
| SK | 7.289 | 7.459 | 2,3% |
| SI | 6.639 | 7.738 | 16,6% |
| ES | 154.795 | 172.191 | 11,2% |
| SE | 44.799 | 51.647 | 15,3% |
| UK | 371.123 | 374.889 | 1,0% |
| EU 28 | 1.712.695 | 1.913.895 | 11,7% |
| IS | 1.269 | 1.624 | 28,0% |
| NO | 33.235 | 36.002 | 8,3% |
| CH | 33.526 | 33.250 | -0,8% |
| Medium and Heavy Commercial Vehicles Over 3.5 t | |||
|---|---|---|---|
| 2015 | 2016 | Evolution 2015-2016 | |
| AT | 7291 | 7992 | 9,6% |
| BE | 9366 | 10738 | 14,6% |
| DK | 0 | – | – |
| HR | 977 | 1325 | 35,6% |
| CZ | 11386 | 11862 | 4,2% |
| DK | 4753 | 5099 | 7,3% |
| EE | 767 | 878 | 14,5% |
| FI | 2670 | 3249 | 21,7% |
| FR | 42780 | 48157 | 12,6% |
| DE | 89723 | 92458 | 3,0% |
| EL | 465 | 321 | -31,0% |
| HU | 5702 | 5513 | -3,3% |
| IE | 2250 | 3040 | 35,1% |
| IT | 15329 | 21156 | 38,0% |
| LV | 1255 | 1588 | 26,5% |
| LT | 3602 | 6004 | 66,7% |
| LU | 1152 | 1288 | 11,8% |
| NL | 14080 | 15720 | 11,6% |
| PL | 22430 | 26630 | 18,7% |
| PT | 4041 | 4557 | 12,8% |
| RO | 6125 | 8032 | 31,1% |
| SK | 2608 | – | – |
| SI | 1907 | 2392 | 25,4% |
| ES | 22568 | 24846 | 10,1% |
| SE | 5456 | 6520 | 19,5% |
| UK | 47890 | 24678 | -48,5% |
| EU 28 | 326573 | 334043 | 2,3% |
| IS | 220 | 318 | 44,5% |
| NO | 5215 | 5988 | 14,8% |
| CH | 4416 | 4483 | 1,5% |
Source: ACEA


