3.1 Toll net revenues in selected countries, 2010-2018 (EUR million)
| 2010 | 2011 | 2012 | 2013 | 2014 | 2015 | 2018 | ||
| DK | 454,0 | 472.00 | 492,0 | 507,0 | 537,0 | 559,0 | 576 | DK |
| EL | 565,0 | 530.00 | 516,0 | 516,0 | 469,0 | 495,0 | 659,61 | EL |
| ES | 1820,6 | 1,808.7 | 1623,8 | 1565,0 | 1608,6 | 1709,3 | 1826,23 | ES |
| FR | 7775,6 | 8,442.6 | 8450,0 | 9170 (1) | 9222,4 | 9160,0 | 10.223,00 | FR |
| IE | 184,0 | 184.00 | 193,0 | 200,0 | 217,0 | 217,0 | 217 | IE |
| IT | 4835,9 | 4,971.00 | 4804,5 | 4914,0 | 5176,9 | 5454,9 | 6.151,51( | IT |
| NL | 27.21 | 28.49 | 26,8 | 26,5 | 27,7 | 28,3 | 35,4 | NL |
| AT | 1,535.50 | 1,561.00 | 1622,1 | 1687,0 | 1826,0 | 1840,0 | 2.163,00 | AT |
| PT | 725.31 | 693.43 | 627,8 | 812,5 | 855,4 | 915,6 | 1.113,89 | PT |
| HU | 145.50 | 167.90 | 167,9 | 189,2 | 677,6 | 677,6 | 755,6 | HU |
| SI | 290.10 | 298.34 | 294,9 | 305,0 | 344,2 | 349,9 | 451,5 | SI |
| HR | 267.40 | 272.34 | 282,8 | 296,69 (2) | 297,1 | 317,3 | 406,15 | HR |
| PL | 189.3 | 148.25 | 157,0 | 179,6 (3) | 185,9 | 209,0 | 270 | PL |
| UK | 70.1 | 64.40 | 71,6 | 77,6 | 83,3 | 102,0 | 101,35 | UK |
| CZ | 262.8 | 325.00 | 346,5 | 342,2 (4) | 316,0 | 360,2 | 419 | CZ |
| DE | 4,484.00 | 4,498.00 | 4364,0 | 4400,0 | 4460,0 | 4370,0 | 5.165,90 | DE |
| RF | – | – | – | 29,3 | 75,2 | 55,5 | – | RF |
| SK | 175.3 | 199.88 | 151,3 | 158,63 (5) | 113,7 | 119,6 | 289,68 | SK |
Source: ASECAP Data as for 31.12.2018
3.2 Budget managed by INEA (Total 33.5 bn) 2017
“The indicative budget to be managed by INEA for 2014-2020 MFF in € billion is:”
CEF Transport € 23,2
CEF Energy € 4,6
CEF Digital € 0,5
H2020 Transport € 2,2
H2020 Energy € 3,0
total € 33,5
3.3 European Investment Bank Loans for Transport to EU 28, 2014-2018 (EUR million)
| 2018 | 2014-2018 | |
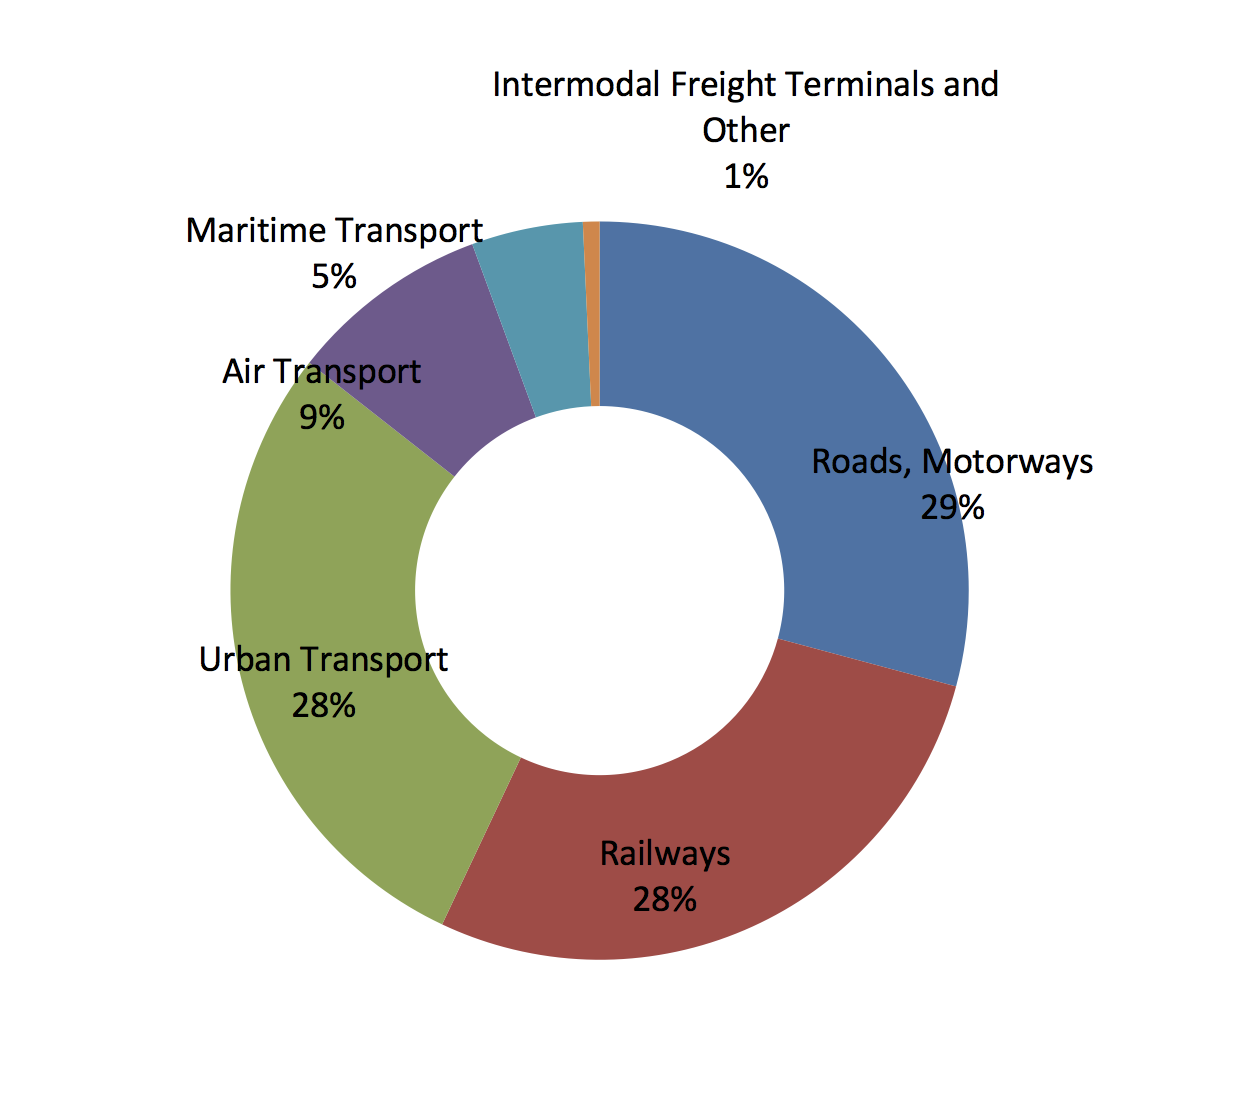
| Roads, Motorways | 2404 | 14967 |
| Railways | 2293 | 18596 |
| Urban Transport | 2354 | 13882 |
| Air Transport | 725 | 3668 |
| Sea Transport | 402 | 2699 |
| Intermodal Freight Terminals and Other | n.a. | 151 |
| Transport | 60 | 130 |
| Total Transport Sector | 8.238 | 54.093 |
Source: EIB
3.4 European Investment Bank Loans for Transport to EU 28, 2018 (total € 8 238 million)
Source: EIB
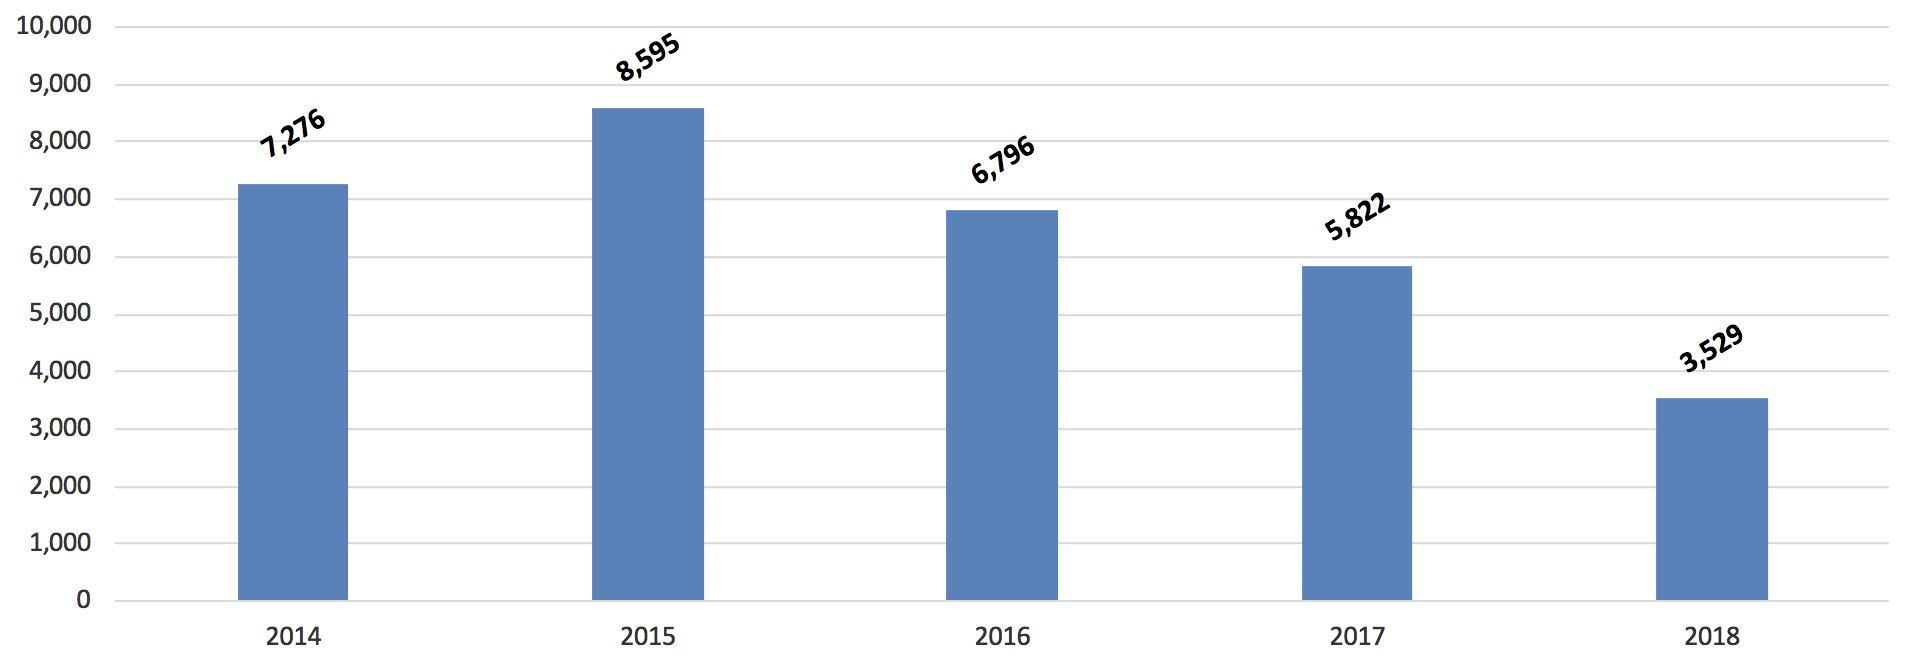
3.5 World Bank Total Transport Lending , 2014-2018 ($ MILLIONS OF DOLLARS)
Note: Numbers may not add to totals because of rounding. As of fiscal 2017, new sector categories have replaced the previous taxonomy as part of an internal data modernization effort. Past fiscal year data reported here have been revised to reflect the new categories and therefore may not match figures published in previous annual reports. Please visit www.projects.worldbank.org/sector for more information on changes.
Source: World Bank
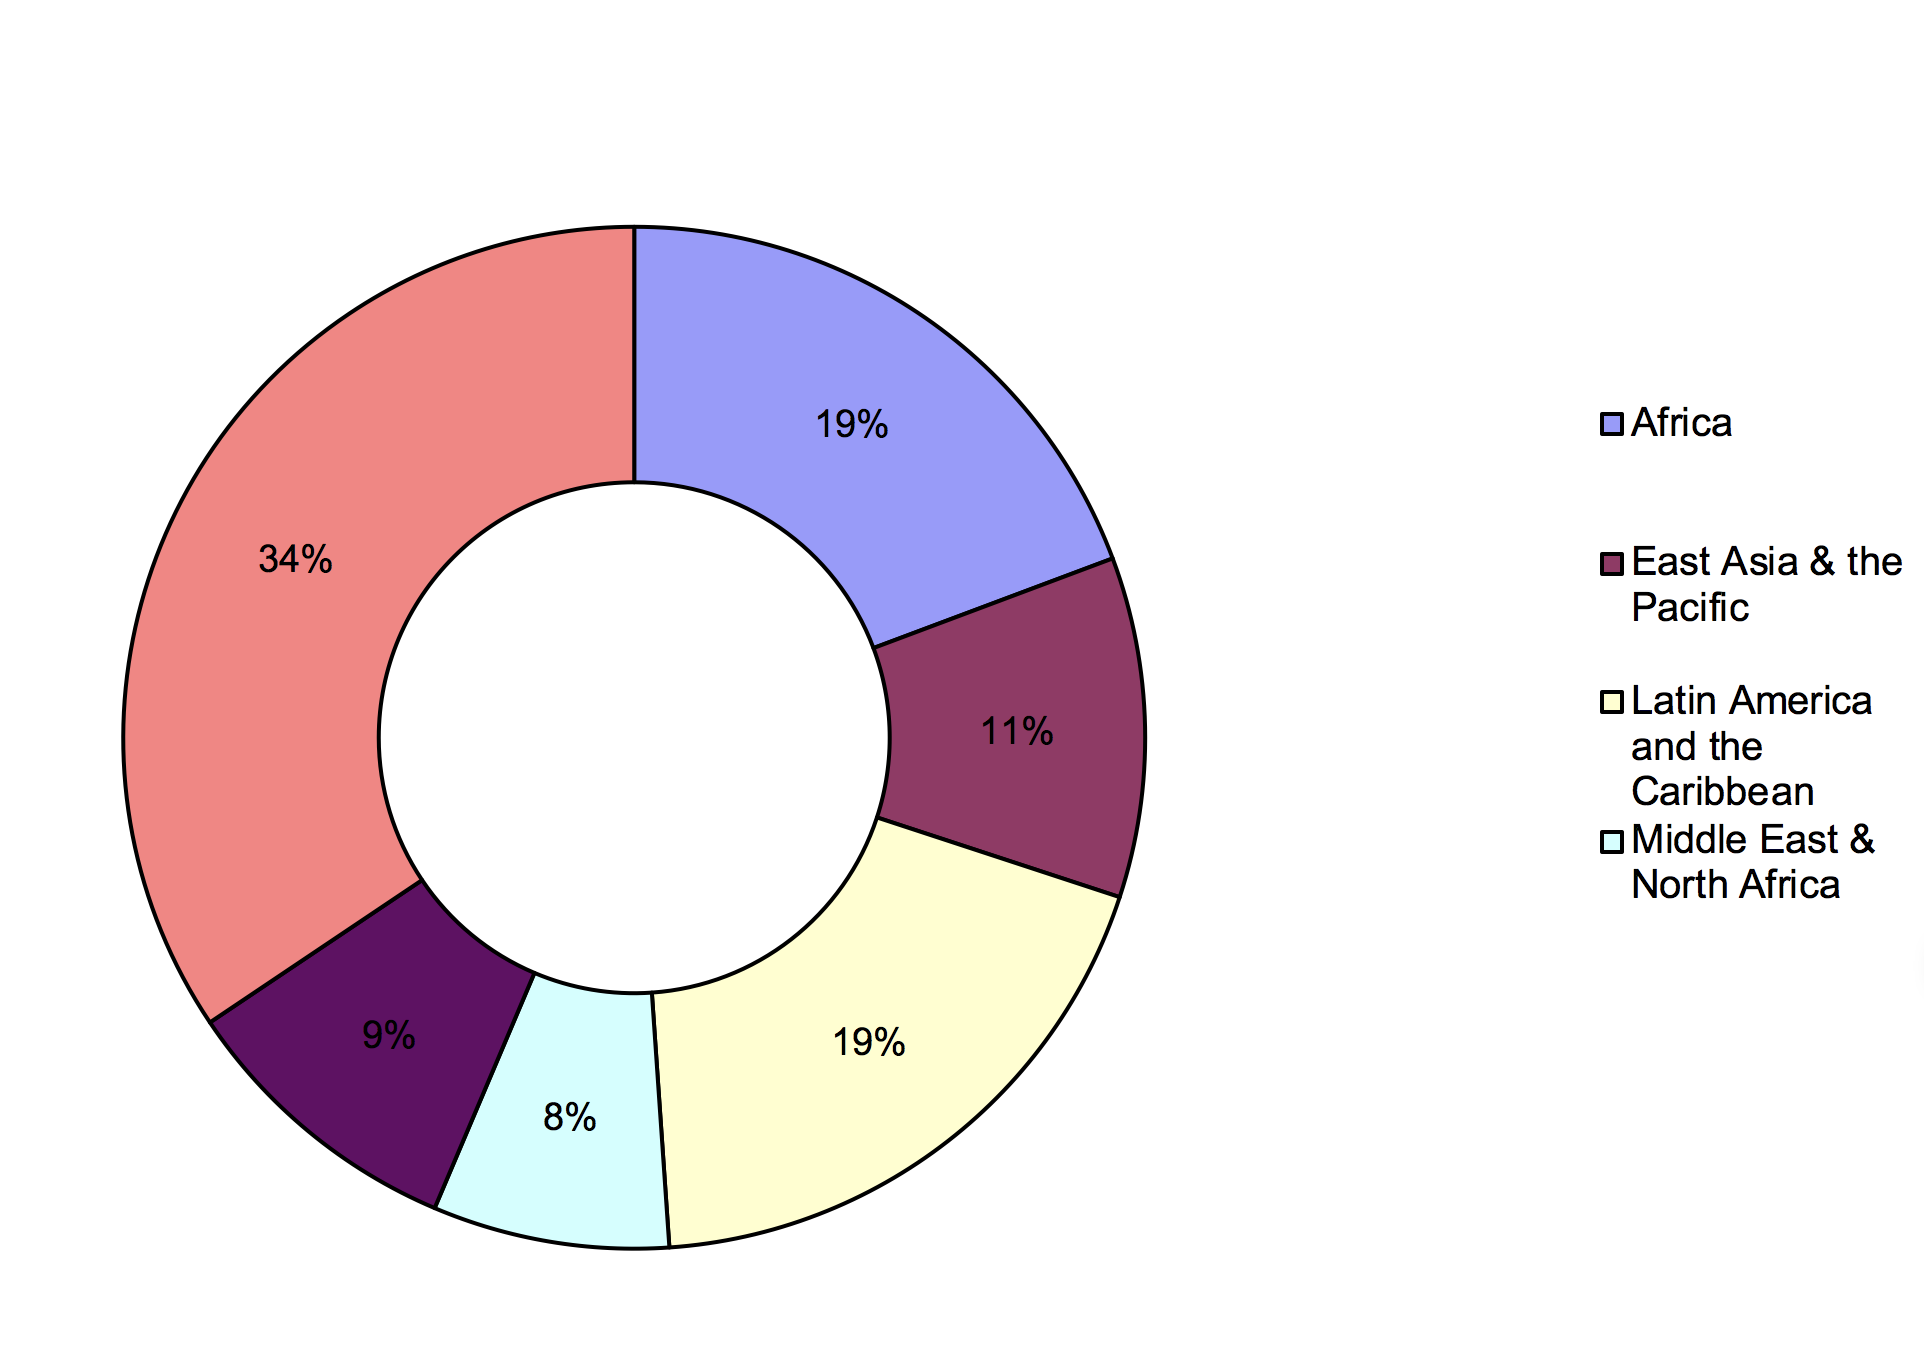
3.6 Transport Lending Breakdown by Region, 2018 (total $ 3,42 billion)
Source: World Bank


