2.1 Length of total road network by category(*) by country, end of 2016 (km)
| Motorways | Main or national roads | Secondary or regional roads | Other roads** | Total | |
| BE | 1 763 | 13 229 | 1 349 | 138 869 | 155 210 |
| BG | 740 | 2 983 | 4 028 | 12 515 | 20 266 |
| CZ | 1 223 | 5 807 | 48 727 | 74 919 | 130 676 |
| DK | 1 255 | 2 598 | 70 705 | 74 558 | |
| DE | 12 996 | 38 068 | 178 906 | 229 970 | |
| EE | 145 | 3 869 | 12 580 | 42 342 | 58 936 |
| IE | 916 | 4 390 | 13 120 | 80 472 | 98 898 |
| EL | 1 843 | 9 299 | 30 864 | 75 600 | 117 606 |
| ES | 15 444 | 14 946 | 135 094 | 501 053 | 666 537 |
| FR | 11 612 | 9 585 | 381 319 | 700 849 | 1 103 365 |
| HR | 1 310 | 6 937 | 9 504 | 9 003 | 26 754 |
| IT | 6 943 | 21 686 | 155 668 | 74 719 | 259 016 |
| CY | 272 | 2 219 | 2 313 | 5 066 | 9 870 |
| LV | – | 1 672 | 5 467 | 60 903 | 68 042 |
| LT | 314 | 6 362 | 14 568 | 50 664 | 71 908 |
| LU | 161 | 837 | 1 891 | 2 889 | |
| HU | 1 924 | 30 062 | 174 599 | 206 585 | |
| MT | – | 2 855 | 2 855 | ||
| NL | 2 758 | 2 599 | 7 757 | 126 180 | 139 294 |
| AT | 1 743 | 10 939 | 23 724 | 100 633 | 137 040 |
| PL | 1 640 | 17 748 | 153 865 | 246 983 | 420 236 |
| PT | 3 065 | 6 457 | 4 791 | 14 313 | |
| RO | 747 | 16 865 | 35 361 | 33 107 | 86 080 |
| SI | 773 | 5 762 | 13 364 | 18 879 | 38 777 |
| SK | 463 | 3 580 | 13 974 | 38 895 | 56 912 |
| FI | 890 | 12 575 | 13 451 | 51 065 | 77 981 |
| SE | 2 118 | 13 576 | 156 920 | 42 291 | 214 905 |
| UK | 3 764 | 49 110 | 33 191 | 336 244 | 422 310 |
| AL | 0 | ||||
| ME | – | 7 811 | 7 811 | ||
| MK | 259 | 640 | 3 778 | 9 733 | 14 410 |
| RS | 610 | 4 034 | 11 392 | 29 374 | 45 410 |
| TR | 2 542 | 31 106 | 33 513 | 175 429 | 242 590 |
| IS | 11 | 4 919 | 2 950 | 5 010 | 12 890 |
| NO | 392 | 10 695 | 44 541 | 39 406 | 95 034 |
| CH | 1 447 | 393 | 17 854 | 51 846 | 71 540 |
Source: Eurostat, International Road Federation, national statistics, estimates
Notes:
*: the definition of road types varies from country to country, the data are therefore not comparable.
“Other roads” sometimes includes roads without a hard surface.
*BE end of 2009 EL end of 2010 IT end of 2015 UK 1st of April 2016 IS end of 2011
2.2 Length of total road network by country, 2016 (km)
Source: EC, IRF
Notes:
“Other roads” sometimes includes roads without a hard surface.
BE end of 2009
EL end of 2010
IT end of 2015
UK 1st April 2016
IS end of 2011
2.3 Density of the total road network in EU countries, 2016 (km road/ km² land area)
Source: EC
Notes:
*: the definition of road types varies from country to country, the data are therefore not comparable.
“Other roads” sometimes includes roads without a hard surface.
BE end of 2009
EL end of 2010
UK 1st Apri,2014
IS end of 2011
MT end of 2012
2.4 Length of motorway network in EU countries, 2016 (km)
Source: Eurostat, International Road Federation, United Nations Economic Commission for Europe, ASECAP statistical bulletin, national statistics, estimates
Notes:
CZ: as from 2016 most of expressways have been changed into class II motorways.
ES: ‘autopistas de peaje’ and ‘autovías y autopistas libres’
CY: from 2006: without urban M-ways
NL: all national roads (‘Rijkswegen’) with dual carriageways
UK: data refers to the 1st of April.
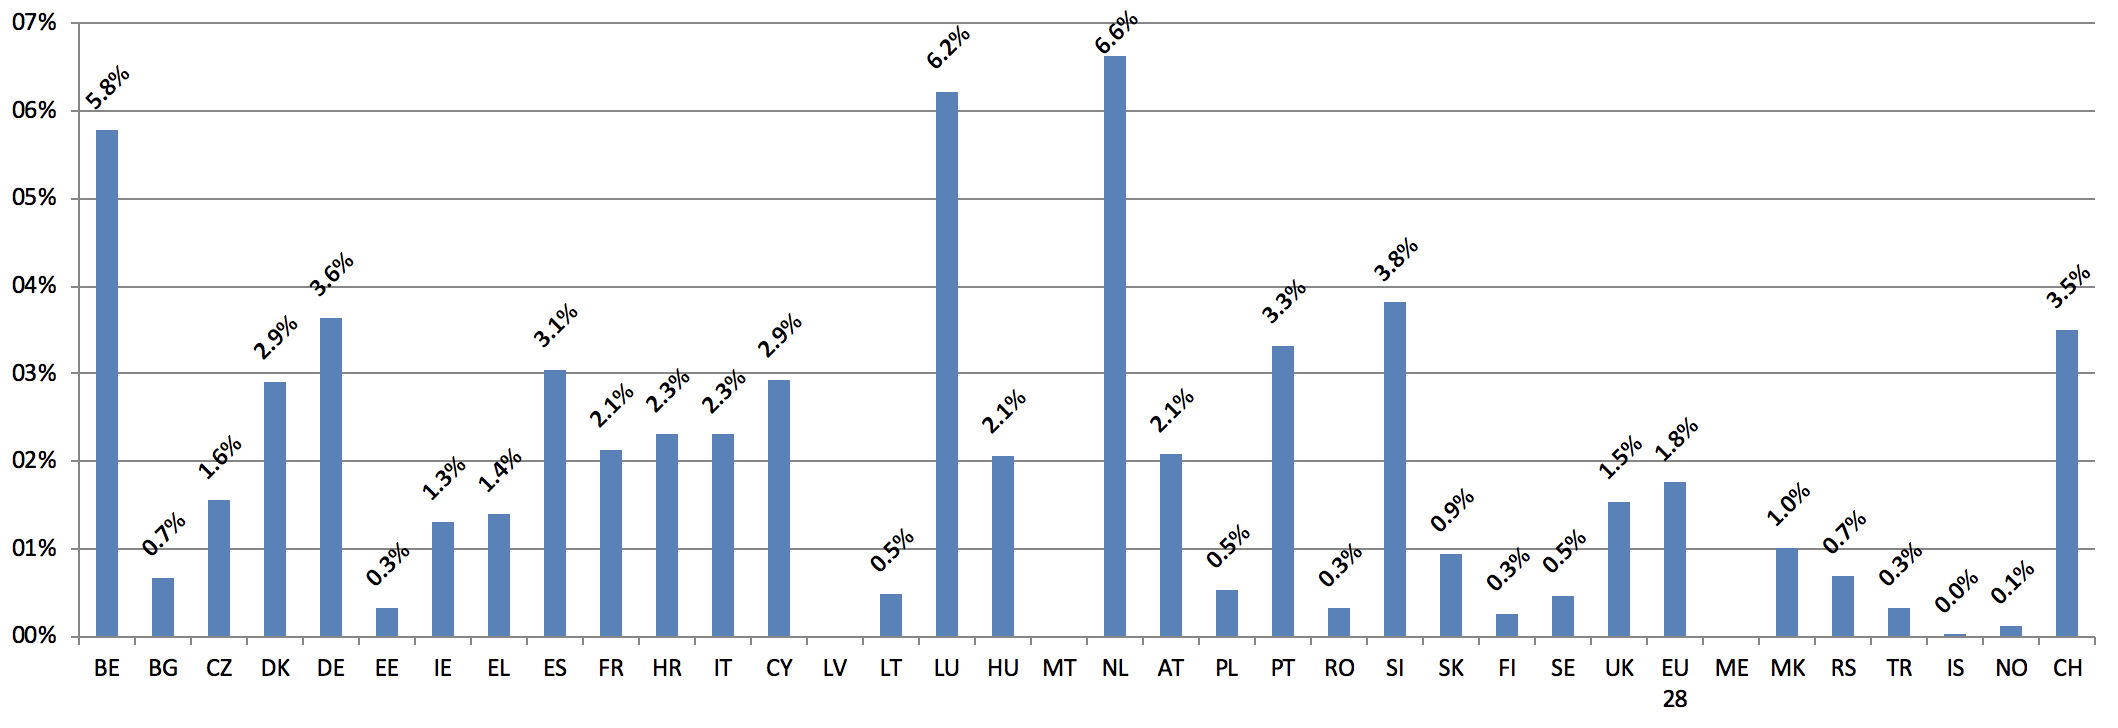
2.5 Proportion of motorways compared to the total road network in EU countries, 2016 (%)
Source: EC
Notes:
“Other roads” sometimes includes roads without a hard surface.
BE end of 2009
EL end of 2010
UK 1st Apri,2014
IS end of 2011
MT end of 2012
2.6 Density of motorways in EU countries, 2016 (km motorway per 100 km² land area)
Source: Eurostat, EC
BE end of 2009
EL end of 2010
UK 1st Apri,2014
IS end of 2011
MT end of 2012
2.7 Passenger cars per km of motorway in EU countries, 2016
Source: Eurostat, EC, UNECE statistical database
Notes:
Stock at end of year, except for BE: 1 August (1 July in 2012), CH: 30 September
Taxis are usually included.
2.8 Transport network Comparison between EU 28, USA, Japan, Russia and China, 2016 (thousand km)
| EU 28 | USA (1) | Japan (2) | China | Russia | |
| Road network (paved) |
5.000 | 4.426 | 998 | 3.756 | 1.054 |
| Motorway network | 76,8 | 97,9 | 9,0 | 104,4 | 52,0 |
| Railway network | 217,1 | 202,3 | 19,2 | 103,1 | 85,4 |
| Electrified rail lines | 116,6 | 11,5 | 36,0 | 43,1 |
Source: Eurostat, International Road Federation, International Transport Forum, Union Internationale des Chemins de Fer, national statistics, estimates
Notes:
(1): Divided highways with 4 or more lanes (rural or urban interstate, freeways, expressways, arterial and collector) with full access control by the authorities.
(2): Japan: national expressways.
(3): Russia: federal roads.
(4): USA: a sum of partly overlapping networks.
(5): China: both oil and gas pipelines
(6): Russia: only crude oil pipelines. 17 thousand km of oil products pipelines are not included.
(7): USA: light duty vehicles, short wheel and long wheel base.
(8): Japan: ordinary, small and light four-wheeled vehicles.
(9): Japan: including 8.7 million light motor vehicles.
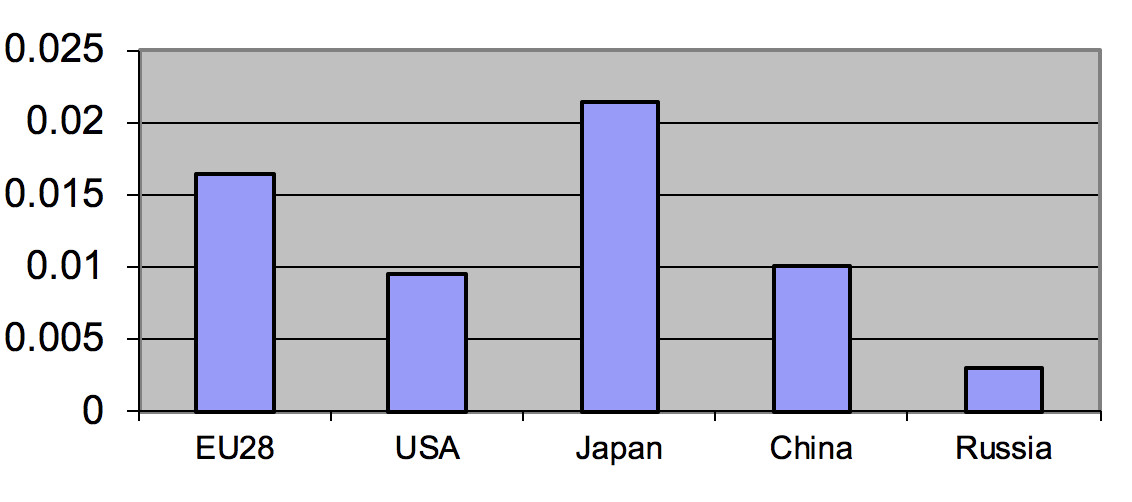
2.9 Density of motorways Comparison between EU 28, USA, Japan, Russia and China, 2016 (km motorway per km² land area)
Source: EC, IRF
Area EU 28: including French overseas department
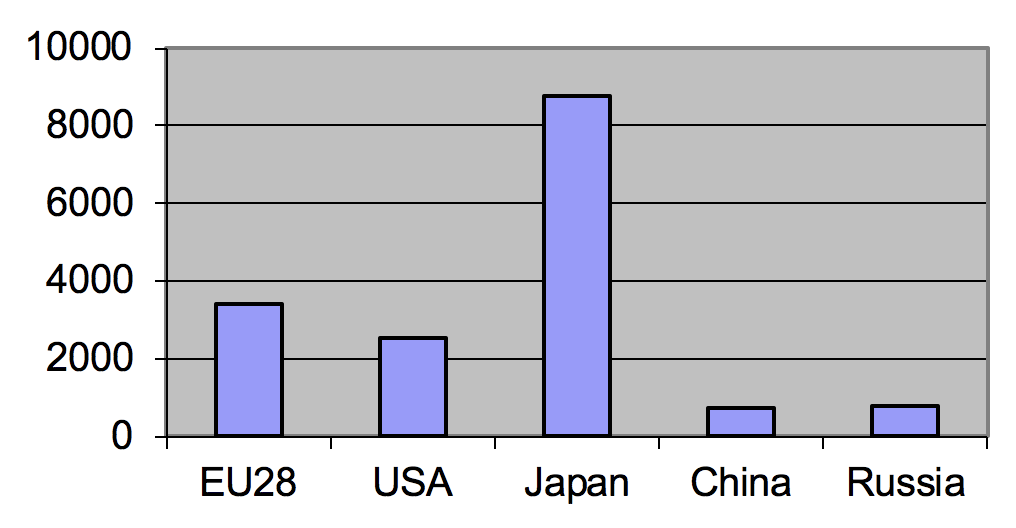
2.10 Passenger cars per km of motorway. Comparison between EU 28, USA, Japan, Russia and China, 2016
Source: EC, IRF
(1) USA: data are from 2009
2.11 Cars/1000 person in EU 28, USA, Japan, Russia and China, 2016
Source: EC


