3.1 Toll net revenues in selected countries, 2010-2022 (EUR million)
| 2010 | 2011 | 2012 | 2013 | 2014 | 2015 | 2018 | 2019 | 2020 | 2021 | 2022 | ||
| DK | 454,0 | 472.00 | 492,0 | 507,0 | 537,0 | 559,0 | 576 | 587 | 479 | 540 | 625 | DK |
| EL | 565,0 | 530.00 | 516,0 | 516,0 | 469,0 | 495,0 | 659,61 | 687,34 | 557,93 | 635,27 | 727,4 | EL |
| ES | 1820,6 | 1,808.7 | 1623,8 | 1565,0 | 1608,6 | 1709,3 | 1826,23 | 1854,49 | 1023,35 | 1085,22 | 789,4 | ES |
| FR | 7775,6 | 8,442.6 | 8450,0 | 9170 (1) | 9222,4 | 9160,0 | 10.223,00 | 10603,24 | 8734,42 | 10362,55 | 11274,72 | FR |
| IE | 184,0 | 184.00 | 193,0 | 200,0 | 217,0 | 217,0 | 217 | 223,8 | 177,07 | 215,41 | 267,6 | IE |
| IT | 4835,9 | 4,971.00 | 4804,5 | 4914,0 | 5176,9 | 5454,9 | 6.151,51( | 5016,95 | 3694,5 | 4745,98 | 4801,46 | IT |
| NL | 27.21 | 28.49 | 26,8 | 26,5 | 27,7 | 28,3 | 35,4 | 36,3 | 28,7 | 30,3 | 33,0 | NL |
| AT | 1,535.50 | 1,561.00 | 1622,1 | 1687,0 | 1826,0 | 1840,0 | 2.156,00 | 2238,6 | 2084,7 | 2304,3 | 2442,9 | AT |
| PT | 725.31 | 693.43 | 627,8 | 812,5 | 855,4 | 915,6 | 1.113,89 | 1205,48 | 918,31 | 1005,07 | 1143,38 | PT |
| HU | 145.50 | 167.90 | 167,9 | 189,2 | 677,6 | 677,6 | 755,6 | 855,51 | — | 1084 | 1084 | HU |
| SI | 290.10 | 298.34 | 294,9 | 305,0 | 344,2 | 349,9 | 451,5 | 466,61 | 387 | 456,3 | 479,5 | SI |
| HR | 267.40 | 272.34 | 282,8 | 296,69 (2) | 297,1 | 317,3 | 406,15 | 425,74 | 286,64 | 366,59 | 426,45 | HR |
| PL | 189.3 | 148.25 | 157,0 | 179,6 (3) | 185,9 | 209,0 | 270 | 274,3 | 292,2 | 320 | 368 | PL |
| CZ | 262.8 | 325.00 | 346,5 | 342,2 (4) | 316,0 | 360,2 | 419 | 419 | — | 304,65 | — | CZ |
| DE | 4,484.00 | 4,498.00 | 4364,0 | 4400,0 | 4460,0 | 4370,0 | 5.165,90 | 7144,3 | 7393,79 | 7610 | 7373 | DE |
| SK | 175.3 | 199.88 | 151,3 | 158,63 (5) | 113,7 | 119,6 | 289,68 | 300,4 | 282,34 | 304,65 | 320,2 | SK |
Source: ASECAP
Data at 31.12.2022
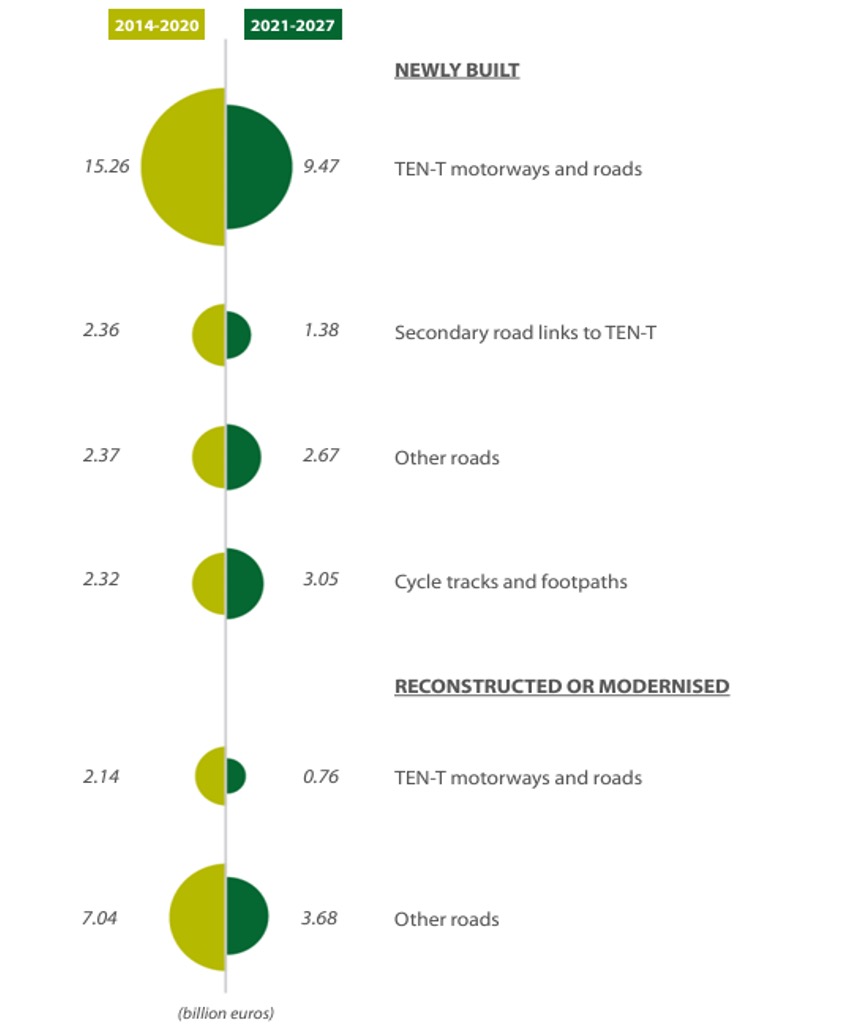
3.2 Comparison of the EU co-funding from cohesion policy funds allocated to road infrastructure for the 2014-2020 and the 2021-2027 periods (billion euros)
Source: ECA, based on cohesion data.
3.3 European Investment Bank Loans for Transport to EU, 2019-2023 (EUR million)
| 2023 | 2019-2023 | |
| Roads, Motorways | 2450 | 8385 |
| Railways | 7068 | 22922 |
| Urban Transport | 4091 | 13945 |
| Air Transport | 670 | 2433 |
| Sea Transport | 194 | 1549 |
| Other form of transport | 6 | 302 |
| Space Transport | n.a. | 237 |
| Tranport infrastructure | n.a. | 11 |
| Transport | 208 | 1362 |
| Total Transport Sector | 14.687 | 51.146 |
Source: EIB
3.4 European Investment Bank Loans for Transport to EU, 2023 (total € 9 333 million)
Source: EIB
3.5 World Bank* Total Transport Commitments , 2015-2023 ($ MILLIONS OF DOLLARS)
Source: World Bank
Note: Numbers may not add to totals because of rounding. As of fiscal 2017, new sector categories have replaced the previous taxonomy as part of an internal data modernization effort. Past fiscal year data reported here have been revised to reflect the new categories and therefore may not match figures published in previous annual reports. Please visit www.projects.worldbank.org/sector for more information on changes.
* IBDR +IDA commitments
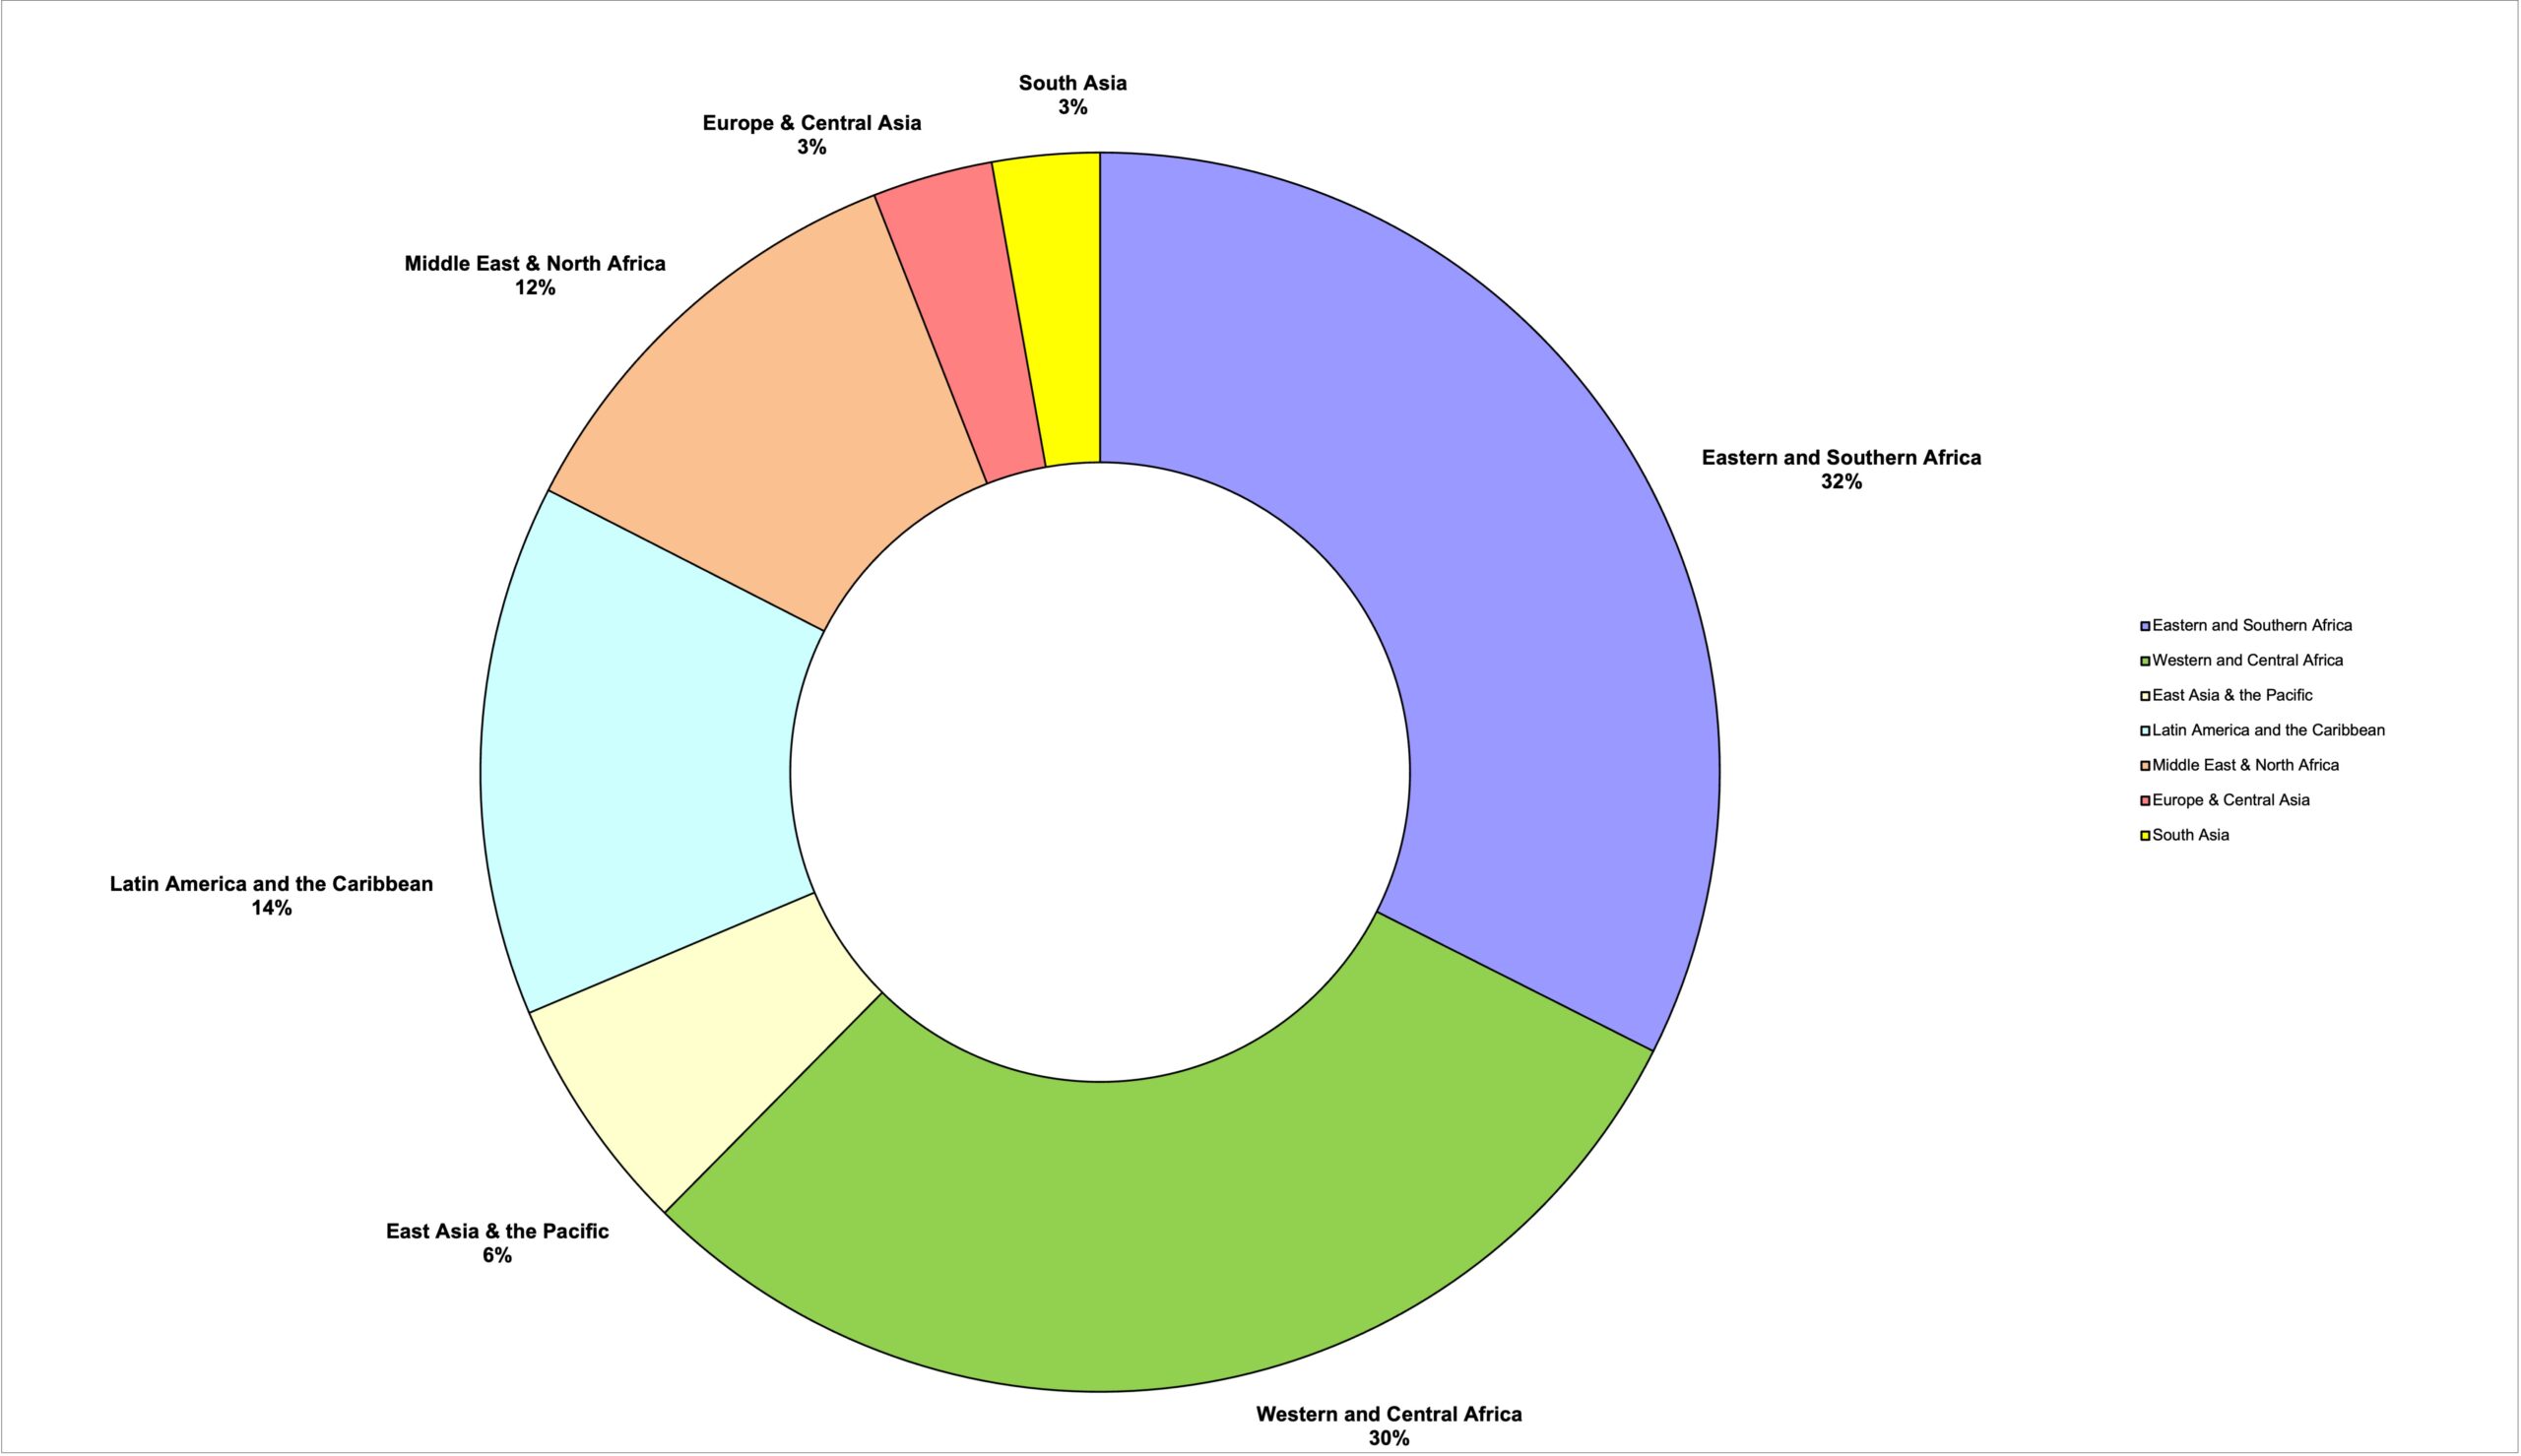
3.6 Transport Lending Breakdown by Region, 2023 (total $ 8,16 billion)
Source: World Bank
* IBDR +IDA lending
No data for Middle East & North Africa


