9.1 Comparison between freight & passenger transport evolution and CO2 emissions in EU 27, 1995-2021
Source: European Environment Agency (EEA), April 2023
9.2 CO2 emissions from Road transport in EU 27, 2000-2021 ( Million tonnes CO2 equivalent)
Source: European Environment Agency, April 2023
9.3 CO2 Emissions from Road Transport, by Transport Mean: EU-27
Source: European Environment Agency (EEA), April 2023
9.4 Average CO2 emissions per km from new passenger cars in EU, 2021-2022
9.4.1 Average CO2 emissions in EU countries, 2021 - 2022 (g CO2 / km)
| 2021 | 2022 | Evolution 2021-2022 | |
| BE | 117 | 104,5 | -10,7% |
| BG | 139,5 | 134,3 | -3,7% |
| CZ | 138,8 | 137,7 | -0,8% |
| DK | 92,3 | 86,3 | -6,5% |
| DE | 113,5 | 105,9 | -6,7% |
| EE | 142,6 | 141,6 | -0,7% |
| IE | 112,6 | 100,7 | -10,6% |
| EL | 119,8 | 118 | -1,5% |
| ES | 126 | 121,5 | -3,6% |
| FR | 108,6 | 103,1 | -5,1% |
| HR | 127,9 | 127,3 | -0,5% |
| IT | 120,3 | 119,2 | -0,9% |
| CY | 145,9 | 136,8 | -6,2% |
| LV | 142,6 | 134,6 | -5,6% |
| LT | 135,7 | 135,9 | 0,1% |
| LU | 123,8 | 115,7 | -6,5% |
| HU | 133,1 | 131,2 | -1,4% |
| MT | 107,5 | 91,4 | -15,0% |
| NL | 95,1 | 86,8 | -8,7% |
| AT | 116,1 | 112 | -3,5% |
| PL | 137,6 | 135,7 | -1,4% |
| PT | 107,1 | 103,1 | -3,7% |
| RO | 125,6 | 119,7 | -4,7% |
| SI | 133,7 | 129,1 | -3,4% |
| SK | 138 | 136,8 | -0,9% |
| FI | 98,3 | 85,3 | -13,2% |
| SE | 88,3 | 66,6 | -24,6% |
| EU 27 | 115,7 | 109,8 | -5,1% |
Source: European Commission – Directorate-General for Climate Action (CLIMA); European Environment Agency (EEA)
9.4.2 Evolution in CO2 emissions in EU countries, 2021 - 2022 (%)
Source: EEA
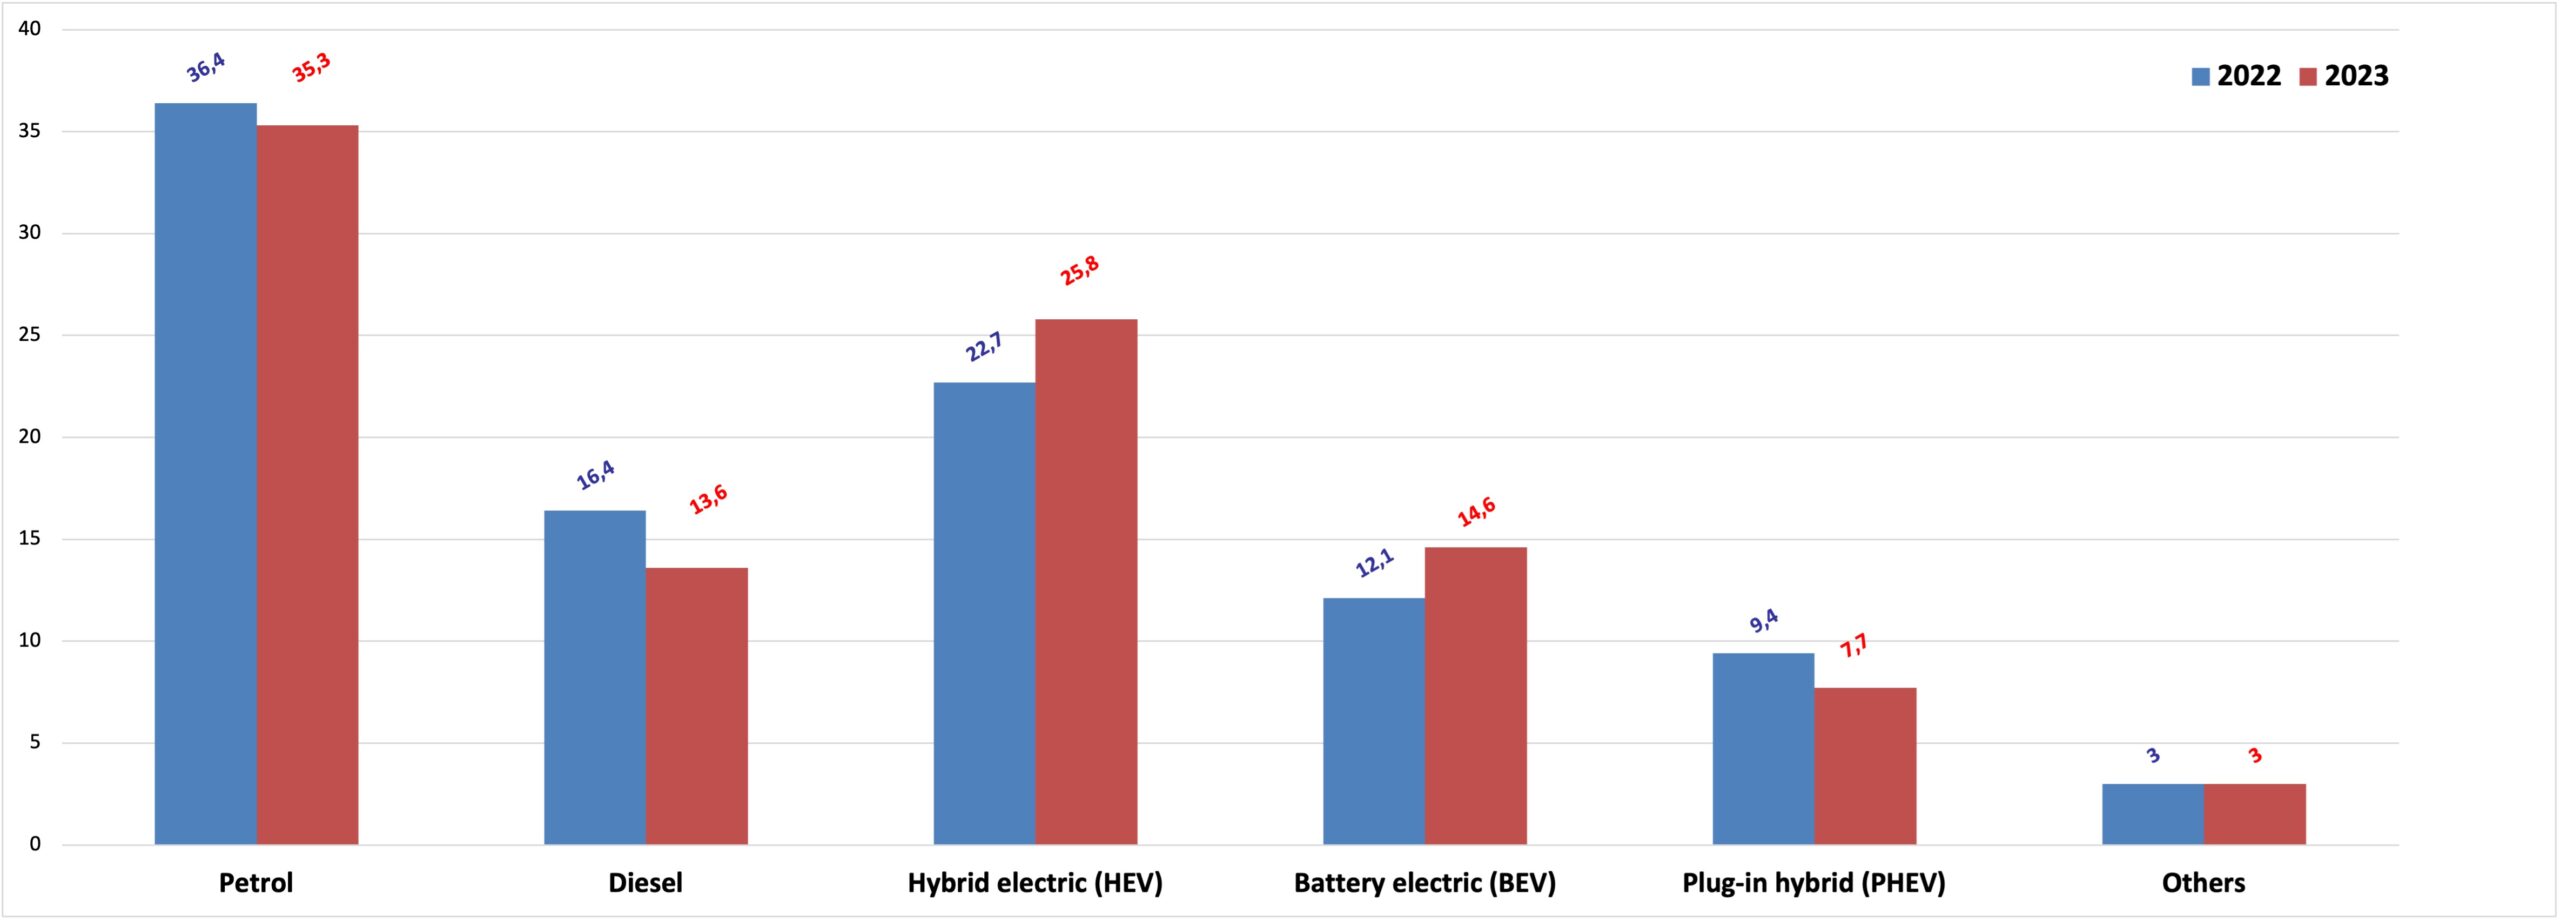
9.5 Fuel market share for new car registrations in EU, 2022-2023
Source: ACEA
9.6 Pure Biodiesel production capacity in EU countries, 2015-2022 (1000 tonnes)
| 2015 | 2016 | 2017 | 2018 | 2019 | 2020 | 2021 | 2022 | |
| BE | 450,0 | 450,0 | 450,0 | 450,0 | 450,0 | 450,0 | 450,0 | 450,0 |
| BG | 160,0 | 160,0 | 160,0 | 160,0 | 180,0 | 180,0 | 260,0 | 268,0 |
| CZ | 420,0 | 420,0 | 420,0 | 420,0 | 420,0 | 420,0 | 420,0 | 420,0 |
| DK | 0,0 | 0,0 | 0,0 | 0,0 | 0,0 | 0,0 | 0,0 | 0,0 |
| DE | 4.212,0 | 4.125,0 | 4.153,0 | 4.279,0 | 4.171,0 | 3.793,0 | 4.120,0 | 4.151,0 |
| EE | 0,0 | 0,0 | 0,0 | 0,0 | 0,0 | 0,0 | 0,0 | 0,0 |
| IE | 29,9 | 29,9 | 53,2 | 53,2 | 53,2 | 79,6 | 141,2 | 162,8 |
| EL | 993,9 | 993,9 | 1.045,4 | 1.045,4 | 1.045,4 | 1.135,4 | 1.135,4 | 0,0 |
| ES | 4.237,0 | 4.237,0 | 4.237,0 | 4.237,0 | 4.237,0 | 4.237,0 | 4.237,0 | 4.237,0 |
| FR | 2.760,0 | 2.305,0 | 2.305,0 | 2.305,0 | 2.305,0 | 2.305,0 | 2.305,0 | 2.305,0 |
| HR | 63,8 | 41,0 | 41,0 | 41,0 | 41,0 | 41,0 | 41,0 | 41,0 |
| IT | 2.212,2 | 2.212,2 | 2.212,2 | 2.212,2 | 2.212,2 | 2.212,2 | 2.212,2 | 2.212,2 |
| CY | 14,1 | 5,0 | 5,0 | 5,0 | 5,0 | 0,0 | 0,0 | 0,0 |
| LV | 173,0 | 173,0 | 173,0 | 173,0 | 173,0 | 173,0 | 173,0 | 173,0 |
| LT | 140,0 | 140,0 | 140,0 | 156,0 | 195,0 | 195,0 | 195,0 | 195,0 |
| LU | 0,0 | 0,0 | 0,0 | 0,0 | 0,0 | 0,0 | 0,0 | 0,0 |
| HU | 150,0 | 157,0 | 172,0 | 180,0 | 180,0 | 180,0 | 180,0 | 220,0 |
| MT | 1,4 | 1,4 | 1,4 | 0,0 | 0,0 | 0,0 | 0,0 | 0,0 |
| NL | 2.176,0 | 1.927,0 | 2.058,0 | 2.082,0 | 2.124,0 | 2.141,0 | 2.269,0 | 2.165,0 |
| AT | 645,5 | 645,5 | 645,5 | 645,5 | 645,5 | 645,5 | 645,5 | 645,5 |
| PL | 1.157,4 | 1.035,9 | 1.188,9 | 1.368,6 | 1.368,6 | 1.576,9 | 1.869,4 | 1.861,2 |
| PT | 721,3 | 721,3 | 721,3 | 721,3 | 721,3 | 721,3 | 721,3 | 721,3 |
| RO | 200,0 | 200,0 | 200,0 | 200,0 | 210,0 | 300,0 | 300,0 | 300,0 |
| SI | 0,0 | 0,0 | 0,0 | 0,0 | 0,0 | 0,0 | 0,0 | 0,0 |
| SK | 177,0 | 125,0 | 125,0 | 125,0 | 125,0 | 135,0 | 120,0 | 120,0 |
| FI | 480,0 | 480,0 | 490,0 | 500,0 | 500,0 | 500,0 | 600,0 | 600,0 |
| SE | 310,0 | 132,5 | 132,0 | 450,0 | 450,0 | 450,0 | 450,0 | 450,0 |
| EU-27 | 21.884,5 | 20.717,6 | 21.129,0 | 21.809,3 | 21.812,3 | 21.870,9 | 22.845,0 | 21.698,0 |
Source: Eurostat
9.7 Renewable energy source share in transport EU-27, 2010-2022 (%)
% Renewable energy sources in transport
Source: Eurostat
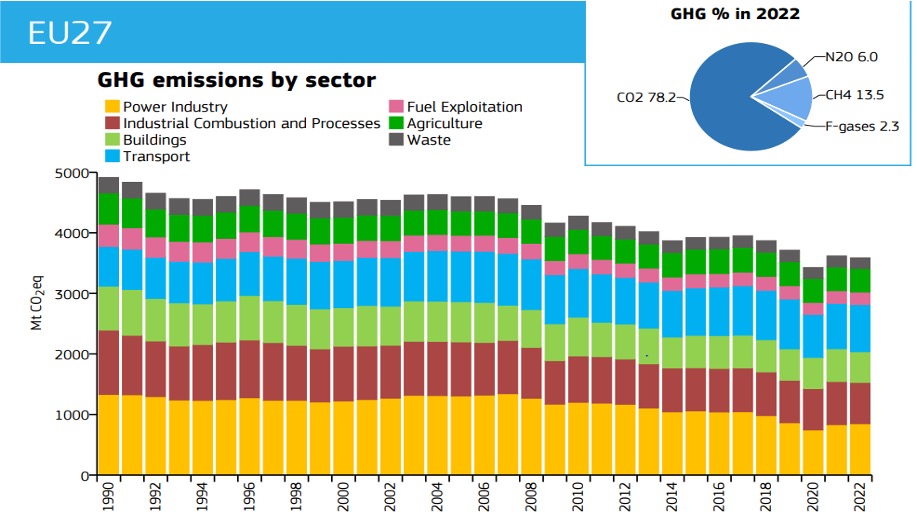
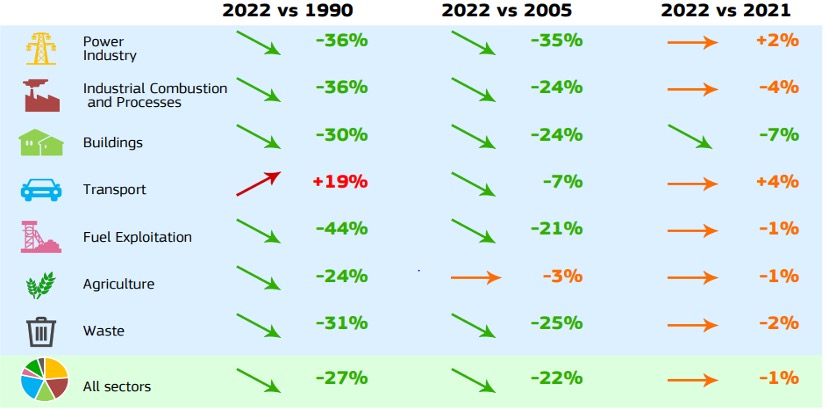
9.8 GHG emissions in EU27 by sector 1990- 2022
Source: JRC – EDGAR
Notes:
CO2= Carbon dioxide
N20= Nitrous oxide
CH4= Methane
F-gases= Fluorinated gases
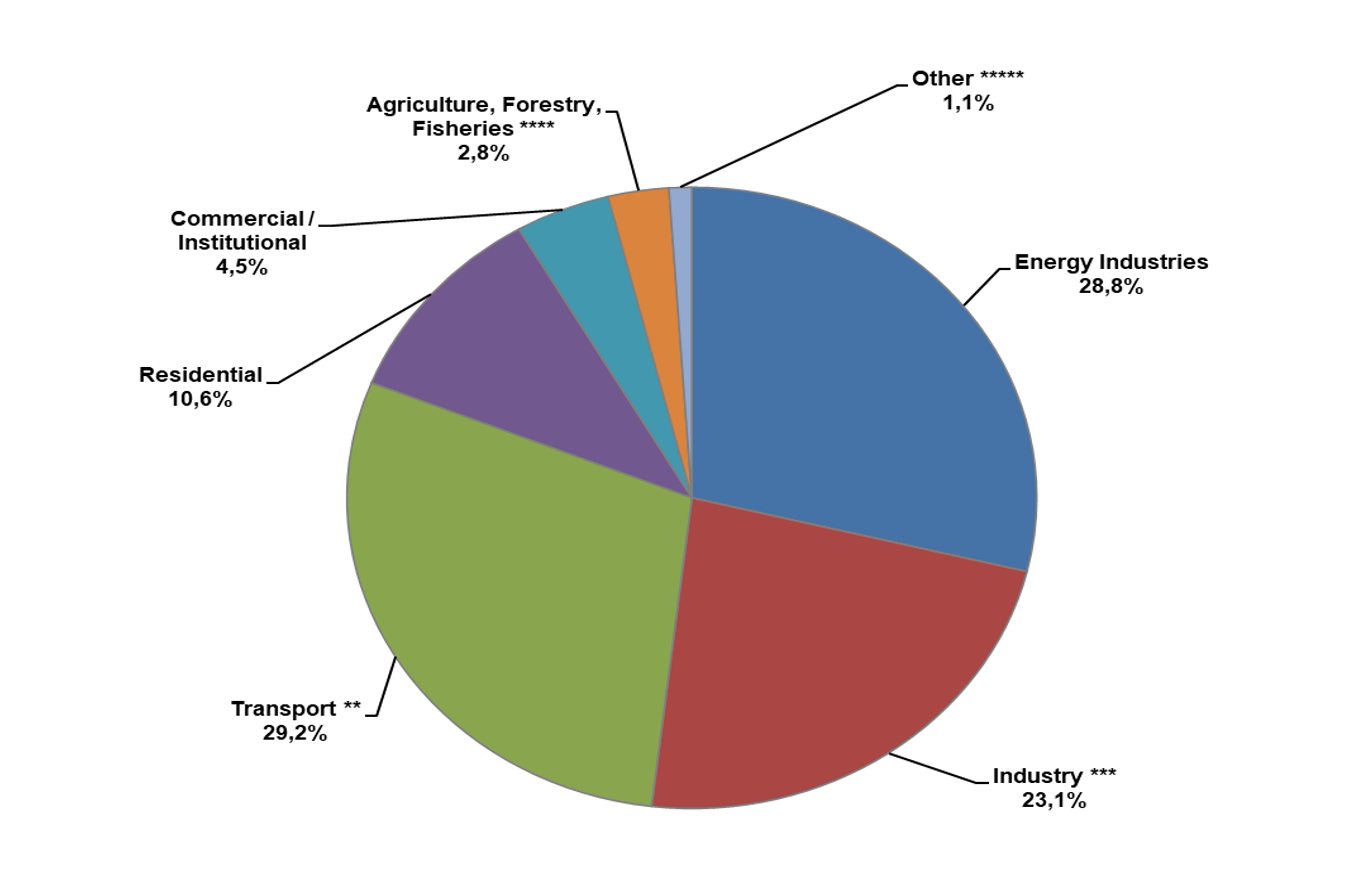
9.9 CO2 emissions by sector in EU* (Mt CO2), 2021
Source: EC
Notes
* Excluding LULUCF emissions and international maritime, including international aviation and indirect CO2.
** Excluding international maritime (international traffic departing from the EU), including international aviation.
*** Emissions from Manufacturing and Construction, Industrial Processes, and Product Use.
**** Emissions from Fuel Combustion and, other Emissions from Agriculture.
***** Emissions from Other (Not elsewhere specified), Fugitive Emissions from Fuels, Waste, Indirect CO2 and Other.
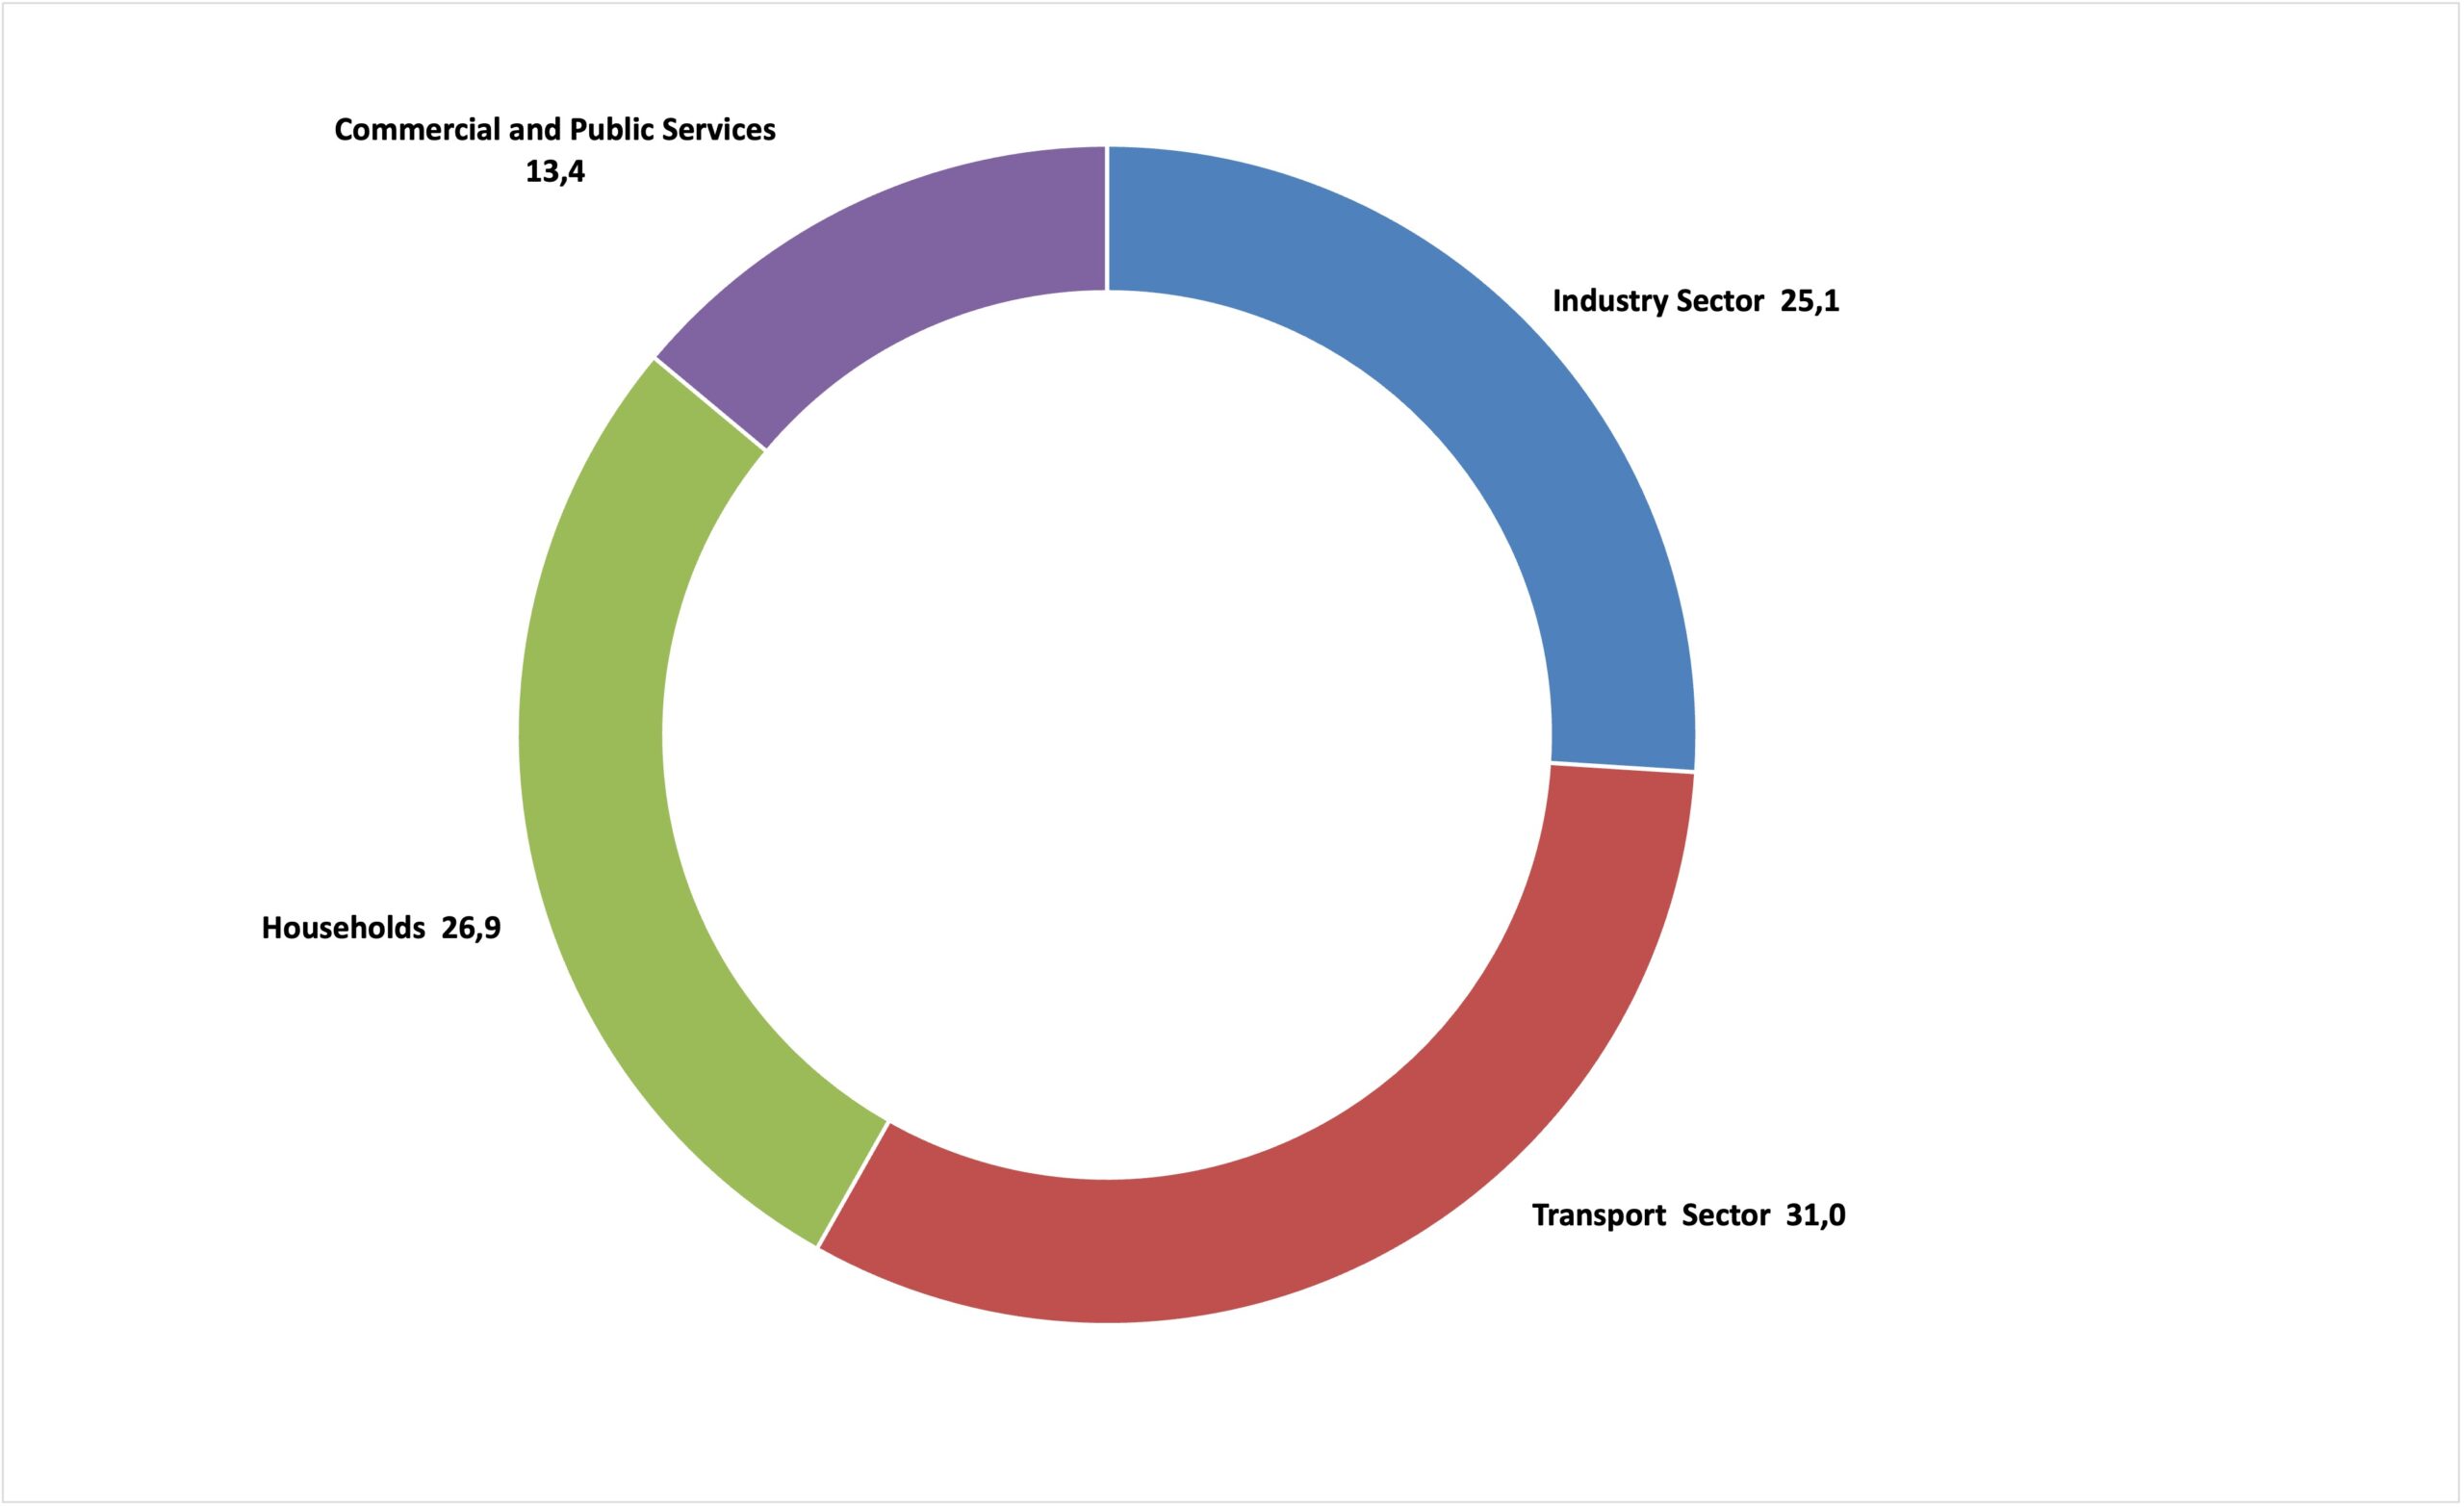
9.10 Final energy consumption by sector in EU27 , 2022 ( % of TOE)
Source: Eurostat


