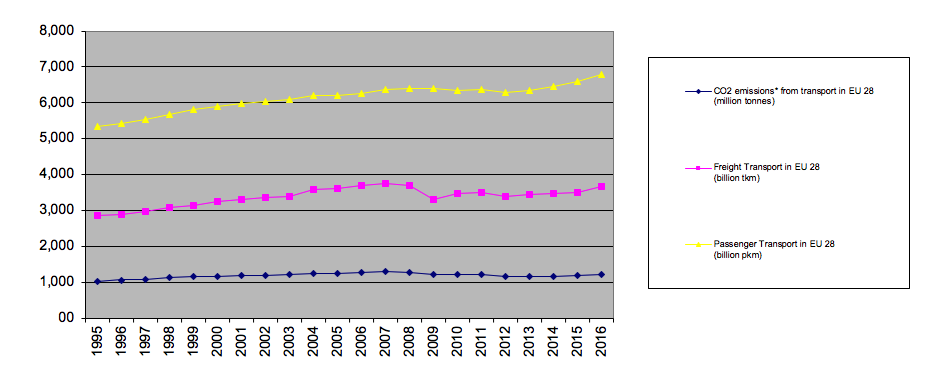
9.1 Comparison between freight & passenger transport evolution and CO2 emissions in EU 28, 1995-2016
Source: EC
* Including International Bunkers (international traffic departing from the EU)
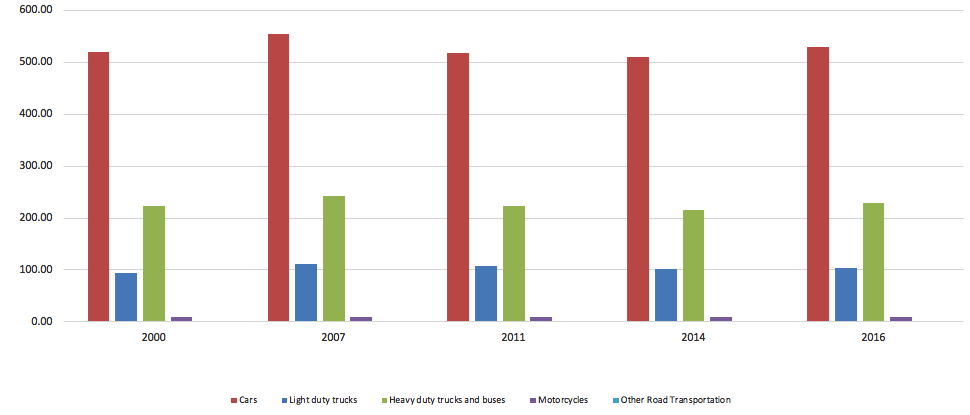
9.2 CO2 emissions from Road transport in EU 28, 2000-2016 ( Million tonnes CO2 equivalent)
Source: EEA
9.3 CO2 Emissions from Road Transport, by Transport Mean: EU-28
Source: European Environment Agency (EEA), June 2018
9.4 Average CO2 emissions per km from new passenger cars in EU, 2016-2017
9.4.1 Average CO2 emissions in EU countries, 2016 - 2017 (g CO2 / km)
| 2016 | 2017 | Evolution 2016-2017 | |
| AT | 120,4 | 120,7 | 0,2% |
| BE | 115,9 | 115,9 | 0,0% |
| BG | 125,8 | 126,2 | 0,3% |
| HR | 111,5 | 113,1 | 1,4% |
| CY | 123,5 | 122,2 | -1,1% |
| CZ | 121,1 | 124,1 | 2,5% |
| DK | 106 | 107,1 | 1,0% |
| EE | 133,9 | 132,8 | -0,8% |
| FI | 120 | 118,2 | -1,5% |
| FR | 109,8 | 110,4 | 0,5% |
| DE | 126,9 | 127,2 | 0,2% |
| EL | 106,3 | 108,8 | 2,4% |
| HU | 125,9 | 125,6 | -0,2% |
| IE | 112 | 111,6 | -0,4% |
| IT | 113,3 | 113,3 | 0,0% |
| LV | 128,9 | 128,8 | -0,1% |
| LT | 126,2 | 127,4 | 1,0% |
| LU | 126,1 | 127 | 0,7% |
| MT | 111,8 | 111 | -0,7% |
| NL | 105,9 | 108,3 | 2,3% |
| PL | 125,8 | 127,6 | 1,4% |
| PT | 104,7 | 104,7 | 0,0% |
| RO | 122 | 120,6 | -1,1% |
| SK | 124,8 | 126,1 | 1,0% |
| SI | 119 | 119,6 | 0,5% |
| ES | 114,4 | 115 | 0,5% |
| SE | 123,1 | 122,3 | -0,6% |
| UK | 120,1 | 121,1 | 0,8% |
| EU 28 | 118,8 | 119,2 | 0,3% |
9.4.2 Evolution in CO2 emissions in EU countries, 2016 - 2017 (%)
Source: EEA
9.4.3 Evolution of CO2 emissions from new passenger cars in EU (gCO2/km)
Source: EEA
9.5 Fuel market share for new car registrations in EU, 2012-2017
Source: ACEA
9.6 Biodiesel production in EU countries, 2005-2017 (1000 tonnes)
| 2005 | 2010 | 2011 | 2012 | 2013 | 2014 | 2015 | 2016 | 2017 | |
| BE | 1 | 435 | 472 | 376 | 565 | 741 | 776 | 846 | 846 |
| BG | – | 30 | 26 | 8 | 13 | 378 | 478 | 356 | 356 |
| CZ | 133 | 181 | 154 | 117 | 210 | 502 | 502 | 452 | 464 |
| DK | 71 | 246 | 225 | 235 | 334 | 250 | 250 | 250 | 250 |
| DE | 1669 | 2861 | 2800 | 2223 | 2516 | 4655 | 4627 | 4005 | 4005 |
| EE | 7 | 3 | 0 | 0 | 0 | 35 | 35 | 35 | 35 |
| IE | – | 28* | 26* | 27* | 24* | 74* | 94 | 74 | 74 |
| EL | 3 | 33 | 78 | 219 | 220 | 702 | 729 | 729 | 729 |
| ES | 73 | 325 | 604 | 400 | 618 | 4194 | 4416 | 3548 | 3398 |
| FR | 492 | 1910 | 1559 | 1964 | 1885 | 2445 | 2080 | 2080 | 2080 |
| HR | – | – | – | 11 | 33 | 55 | 55 | 55 | 55 |
| IT | 396 | 706 | 479 | 349 | 387 | 1837 | 1545 | 1525 | 1525 |
| CY | 1 | 6 | 6 | 6 | 1 | 20 | 20 | 20 | 20 |
| LV | 5 | 43 | 56 | 81 | 61 | 156 | 156 | 154 | 154 |
| LT | 7 | 85 | 79 | 107 | 118 | 147 | 147 | 147 | 147 |
| LU | – | 0 | 0 | 0 | 0 | 20 | 20 | 0 | 0 |
| HU | – | 149 | 150 | 150 | 150 | 158 | 183 | 183 | 188 |
| MT | 2 | 0 | 0 | 1 | 1 | 5 | 5 | 5 | 5 |
| NL | – | 368 | 370 | 1102* | 1248* | 2505 | 2505 | 2505 | 2505 |
| AT | 85 | 289 | 226 | 114 | 239 | 495 | 524 | 524 | 524 |
| PL | 100 | 370 | 363 | 602 | 648 | 1269 | 1239 | 1239 | 1239 |
| PT | 1 | 289 | 287 | 176 | 314 | 590 | 670 | 639 | 639 |
| RO | – | 70 | 101 | 100 | 137 | 407 | 347 | 295 | 295 |
| SI | 8 | 22 | 0 | 1 | 2 | 108 | 108 | 100 | 100 |
| SK | 78 | 88 | 103 | 110 | 105 | 158 | 156 | 166 | 166 |
| FI | – | 288 | 225* | 251* | 320* | 400* | 430 | 430 | 430 |
| SE | 1 | 246 | 225 | 235 | 334 | 282 | 362 | 362 | 362 |
| UK | 51 | 145 | 218 | 197 | 277 | 505 | 537 | 528 | 528 |
| Total | 3183 | 8723 | 8083 | 7398 | 8590 | 21500 | 22996 | 21252 | 21119 |
Calculation based on 330 working days per year,
per plant. (situation at 01/07/2017)
* IE, FI, NL: Data include hydro-diesel production
(*) 2010 Biodiesel production of SE is included in the 246.000 tonnes indicated for DK
9.7 Biofuels share in transport consumption in EU, 1996-2017 (%)
Source: Eurostat
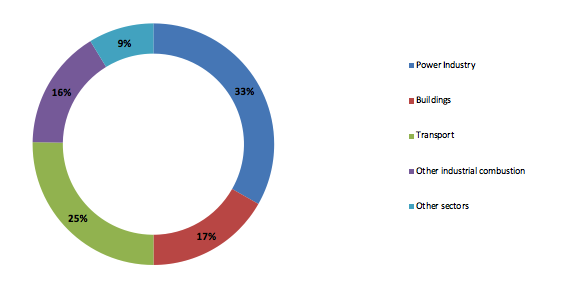
9.8 Share of total CO2 emmissions from fossil fuel by sector in EU (Mt CO2), 2017
Source: JRC – EDGAR
9.9 Final energy consumption by sector in EU countries, 2017 ( % of TOE)
| Industry Sector | Transport Sector | Households | Commercial and Public Services | |
| European Union – 28 countries | 24,63% | 30,84% | 27,17% | 14,53% |
| Belgium | 31,91% | 26,93% | 24,65% | 13,97% |
| Bulgaria | 27,94% | 34,15% | 23,81% | 12,32% |
| Czechia | 27,46% | 27,11% | 29,45% | 13,07% |
| Denmark | 16,91% | 30,44% | 32,79% | 14,50% |
| Germany | 27,50% | 27,98% | 27,64% | 16,84% |
| Estonia | 16,26% | 28,61% | 33,59% | 16,80% |
| Ireland | 23,36% | 37,64% | 24,01% | 12,79% |
| Greece | 19,29% | 36,22% | 27,49% | 13,65% |
| Spain | 23,90% | 39,95% | 19,44% | 13,12% |
| France | 18,82% | 32,17% | 28,83% | 16,90% |
| Croatia | 17,41% | 32,30% | 35,08% | 11,81% |
| Italy | 21,94% | 30,39% | 28,96% | 16,06% |
| Cyprus | 14,94% | 44,03% | 21,91% | 14,94% |
| Latvia | 20,47% | 27,89% | 30,88% | 15,69% |
| Lithuania | 20,43% | 37,44% | 27,77% | 12,09% |
| Luxembourg | 17,76% | 54,45% | 14,47% | 12,60% |
| Hungary | 24,18% | 25,18% | 35,04% | 11,99% |
| Malta | 11,55% | 42,15% | 19,03% | 25,52% |
| Netherlands | 30,80% | 23,74% | 21,58% | 15,19% |
| Austria | 30,72% | 33,02% | 25,16% | 9,10% |
| Poland | 22,91% | 31,00% | 28,83% | 11,64% |
| Portugal | 29,63% | 37,93% | 16,84% | 12,43% |
| Romania | 27,95% | 26,90% | 33,59% | 8,05% |
| Slovenia | 26,78% | 38,22% | 23,16% | 9,93% |
| Slovakia | 34,86% | 28,00% | 21,29% | 14,41% |
| Finland | 43,50% | 17,02% | 23,39% | 12,06% |
| Sweden | 33,42% | 25,83% | 23,19% | 12,57% |
| United Kingdom | 18,76% | 34,52% | 30,59% | 14,11% |
Source: Eurostat


