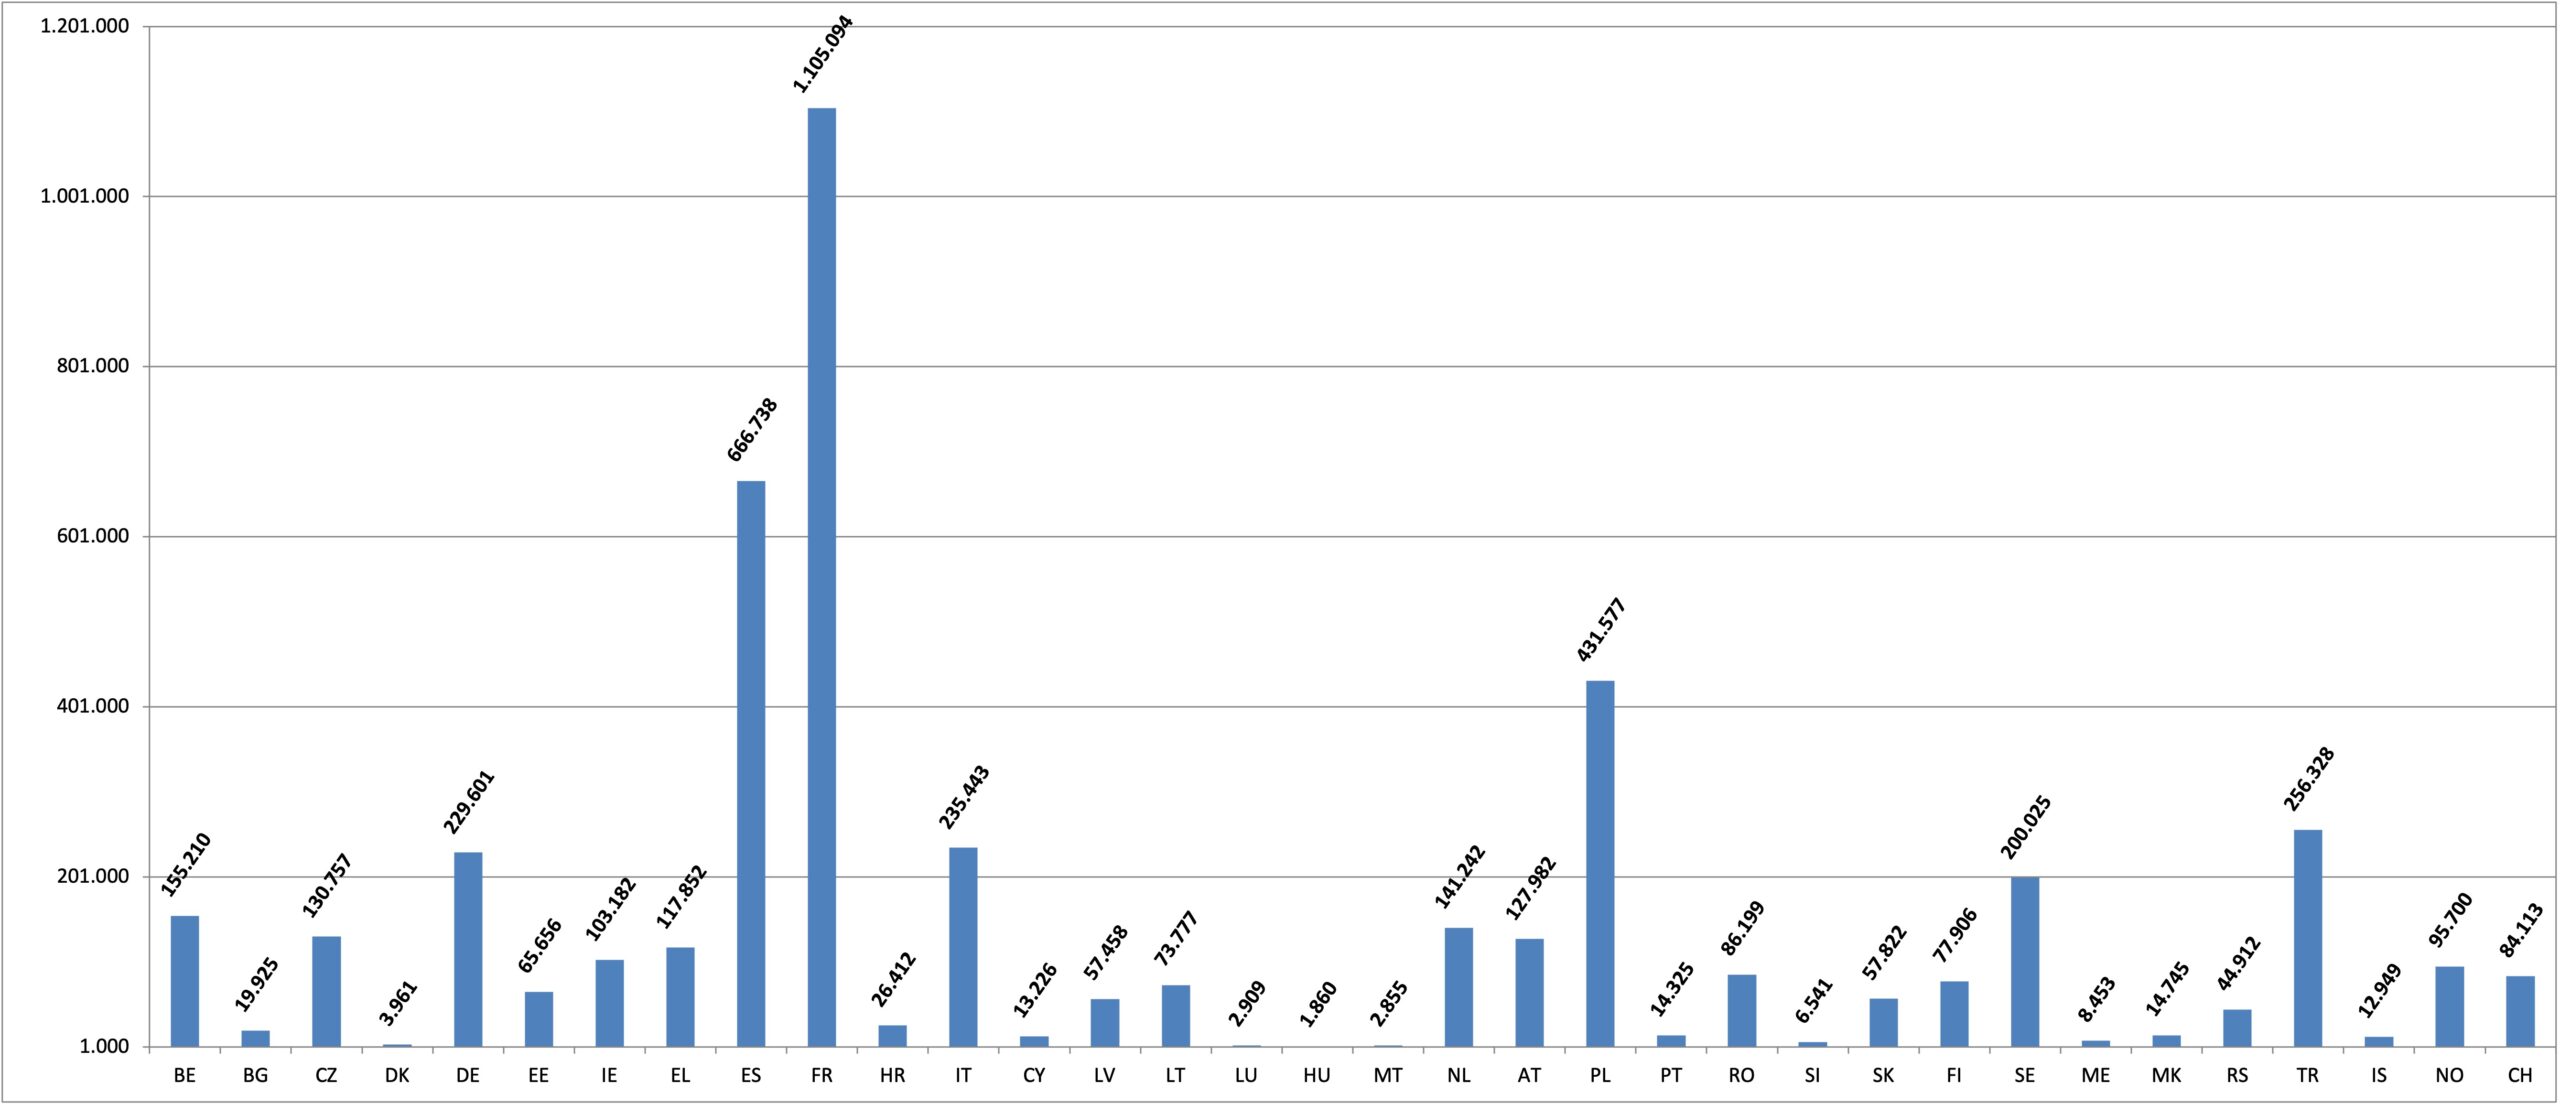
2.1 Length of total road network by category(*) by country, end of 2021* (km)
| Motorways | Main or national roads | Secondary or regional roads | Other roads** | Total | |
| BE | 1 763 | 13 229 | 1 349 | 138 869 | 155 210 |
| BG | 806 | 2 883 | 4 019 | 12 217 | 19 925 |
| CZ | 1 346 | 5 800 | 48 692 | 74 919 | 130 757 |
| DK | 1 355 | 2 606 | 70 935 | 74 896 | |
| DE | 13 155 | 37 824 | 178 622 | — | 229 601 |
| EE | 199 | 3 813 | 12 921 | 48 723 | 65 656 |
| IE | 995 | 5 419 | 13 382 | 83 386 | 103 182 |
| EL | 2 159 | 9 229 | 30 864 | 75 600 | 117 852 |
| ES | 15 860 | 14 880 | 134 945 | 501 053 | 666 738 |
| FR | 11 664 | 9 581 | 378 906 | 704 942 | 1 105 094 |
| HR | 1 316 | 7 180 | 9 422 | 8 494 | 26 412 |
| IT | 6 978 | 28 307 | 132 626 | 67 532 | 235 443 |
| CY | 257 | 5 461 | 2 461 | 5 047 | 13 226 |
| LV | — | 20 034 | 28 967 | 8 457 | 57 458 |
| LT | 400 | 6 679 | 14 559 | 52 139 | 73 777 |
| LU | 163 | 850 | 1 877 | 19 | 2 909 |
| HU | 1 860 | 30 662 | 183 989 | 216 511 | |
| MT | — | 2 855 | — | 2 855 | |
| NL | 2 790 | 2 743 | 7 905 | 127 804 | 141 242 |
| AT | 1 749 | 10 762 | 23 555 | 91 916 | 127 982 |
| PL | 1 761 | 19 498 | 153 782 | 256 536 | 431 577 |
| PT | 3 065 | 6 469 | 4 791 | — | 14 325 |
| RO | 931 | 16 599 | 35 096 | 33 573 | 86 199 |
| SI | 616 | 5 925 | 32 259 | 38 800 | |
| SK | 545 | 3 643 | 13 964 | 39 670 | 57 822 |
| FI | 944 | 12 514 | 13 461 | 50 987 | 77 906 |
| SE | 2 185 | 13 497 | 141 187 | 43 156 | 200 025 |
| ME | — | 8 453 | 8 453 | ||
| MK | 335 | 897 | 3 794 | 9 719 | 14 745 |
| RS | 932 | 13 527 | — | 30 453 | 44 912 |
| TR | 3 523 | 30 974 | 34 136 | 187 695 | 256 328 |
| IS | 41 | 4 370 | 3 380 | 5 158 | 12 949 |
| NO | 580 | 10 511 | 44 730 | 39 879 | 95 700 |
| CH | 1 544 | 710 | 17 219 | 64 640 | 84 113 |
Source: Eurostat [road_if_roadsc], International Road Federation (www.irfnet.ch) (BE, EL, LU, MT, IS), national statistics
Notes:
*BE end of 2015; EL: 2018; LU: 2018 (other roads); IT, RS and TR: 2020 data;
CY: other road network includes forest gravel roads
**: the definition of road types varies from country to country, the data are therefore not fully comparable. CY: other road network includes forest gravel roads.
2.2 Length of total road network by country, 2021 (km)
Source: EC, IRF
Notes:
BE end of 2015
EL end of 2018
LU: 2018
IT: 2020 data
2.3 Density of the total road network in EU countries, 2021 (km road/ km² land area)
Source: EC
Notes:
BE end of 2015
EL end of 2018
LU: 2018
IT: 2020 data
2.4 Length of motorway network in EU countries, 2021 (km)
Notes:
BE end of 2015
EL end of 2018
LU: 2018
IT: 2020 data
2.5 Proportion of motorways compared to the total road network in EU countries, 2021 (%)
Source: EC
Notes:
BE end of 2015
EL end of 2018
LU: 2018
IT: 2020 data
2.6 Density of motorways in EU countries, 2021 (km motorway per 100 km² land area)
Source: Eurostat, EC
BE end of 2015
EL end of 2018
LU: 2018
IT: 2020 data
2.7 Passenger cars per km of motorway in selected countries, 2021
Stock at end of year, except for BE: 1 August (1 July in 2012), CH: 30 September.
Taxis are usually included.
HR: from 2009 light vans are included in passenger cars and no longer in goods vehicles
FR: provisional data for 2020
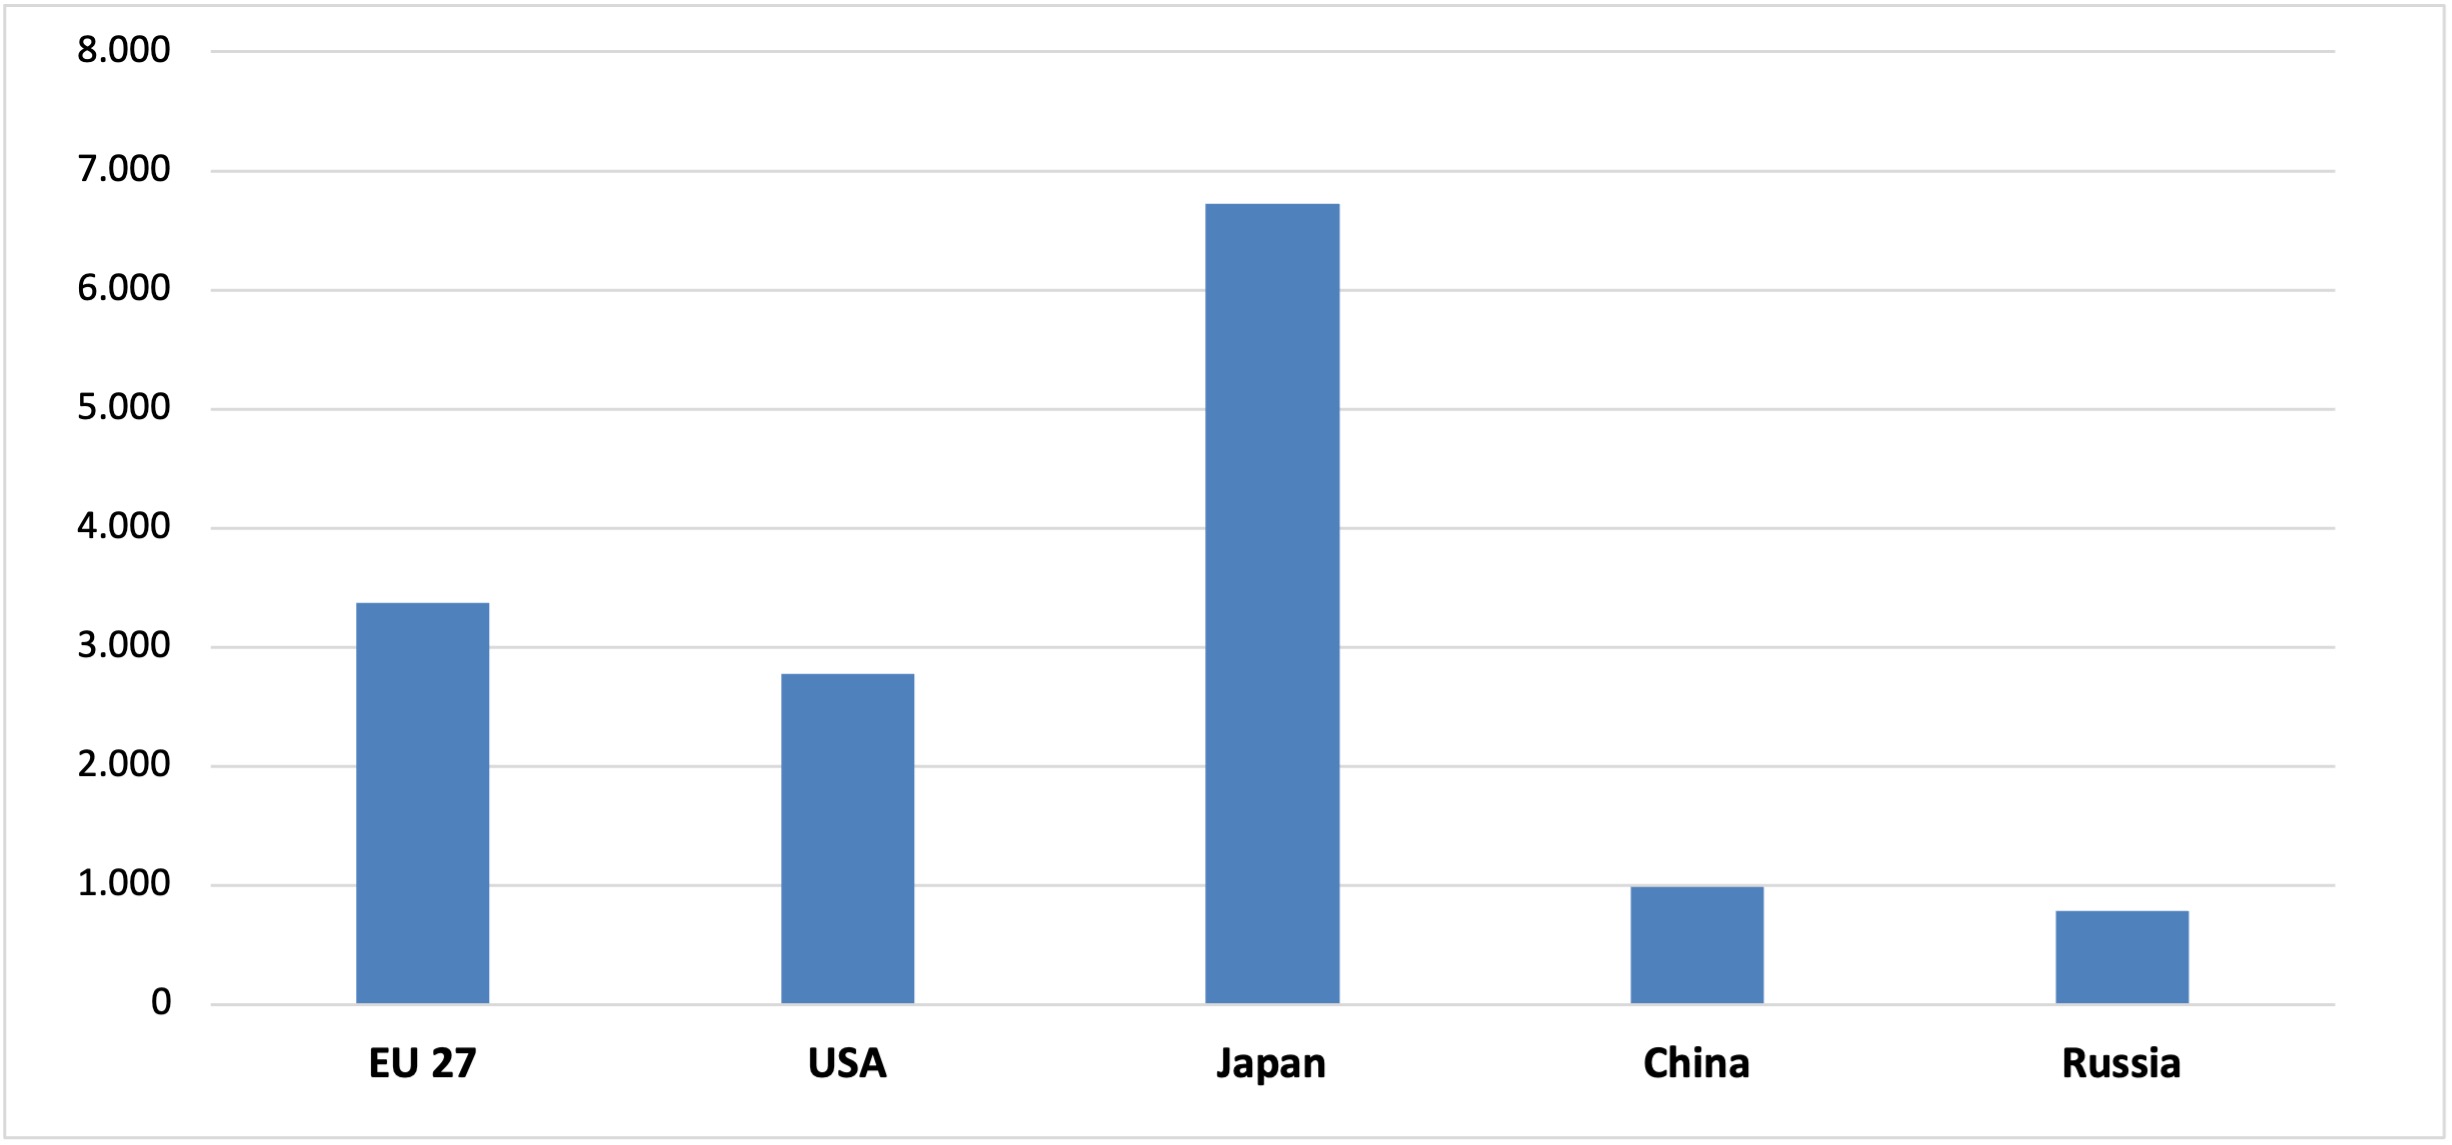
2.8 Transport network Comparison between EU 27, USA, Japan, Russia and China, 2021 (thousand km)
| EU 27 | USA (1) | Japan (2) | China(4) | Russia(3) | |
| Road network (paved) |
4.473,0 | 4.577 | 1.069 | 5.062 | 1.212 |
| Motorway network | 75,0 | 92,8 | 9,2 | 169,1 | 64,0 |
| Railway network | 203,0 | 197,0 | 18,9 | 150,7 | 87,0 |
| Electrified rail lines | 114,0 | — | 11,7 | 110,8 | 45,0 |
Source: Chapter 2.5, 2.6 and 2.7, International Transport Forum (fatalities data for JP, RU all data) , Union Internationale des Chemins de Fer (JP, CN), national statistics (CN, JP, US)
Notes:
(1):2020 data. Divided highways with 4 or more lanes (rural or urban interstate, freeways, expressways, arterial and collector) with full access control by the authorities. For the railways data:a sum of partly overlapping networks.
(2): Japan: national expressways.2020 data.
(3): RU: roads of federal importance.
(4): China: both oil and gas pipelines
2.9 Density of motorways Comparison between EU 27, USA, Japan, Russia and China, 2021 (km motorway per km² land area)
Source: EC
2.10 Passenger cars per km of motorway. Comparison between EU 27, USA, Japan, Russia and China, 2021
Source: Eurostat, International Road Federation, International Transport Forum, Union Internationale des Chemins de Fer, national statistics
2.11 Cars/1000 person in EU 27, USA, Japan, Russia and China, 2021
Source: EC


