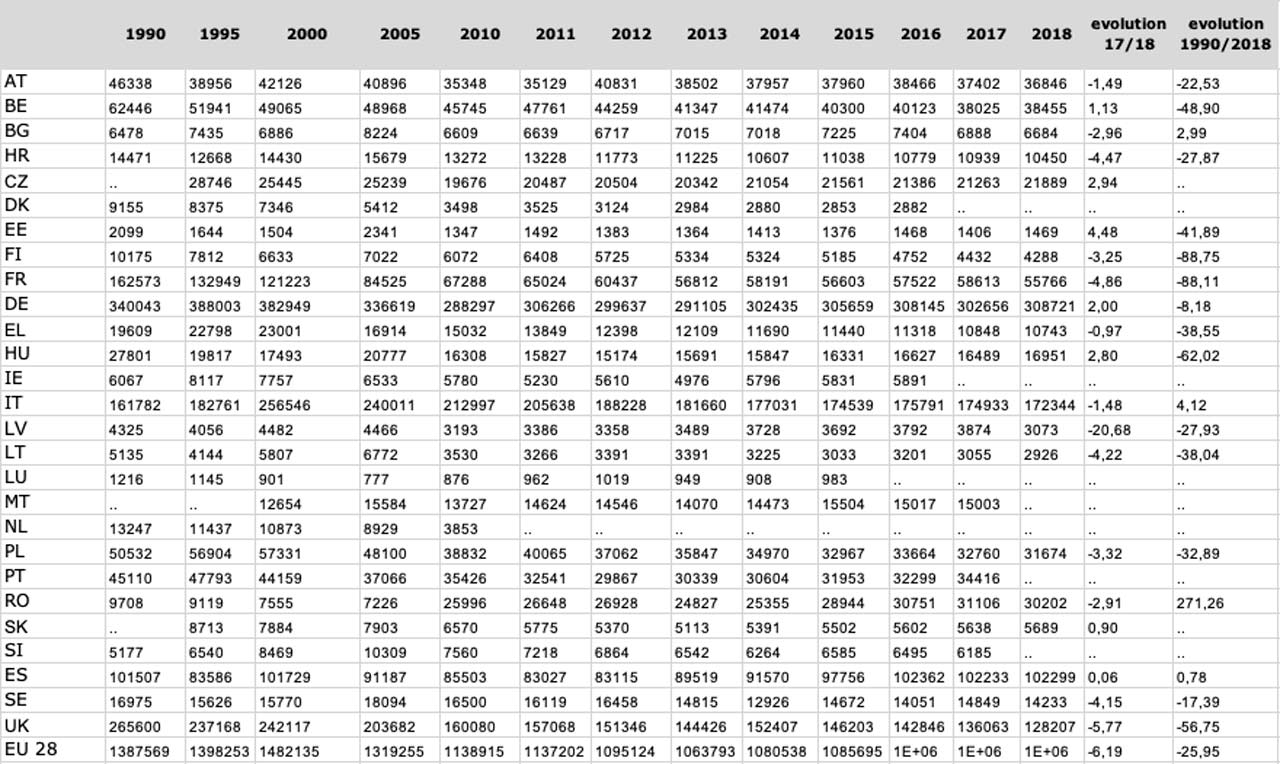
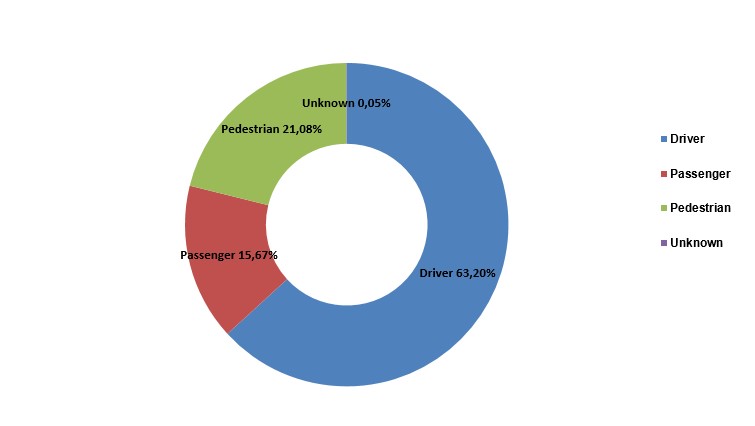
7.1 Road accidents involving personal injury by country, 1990-2018
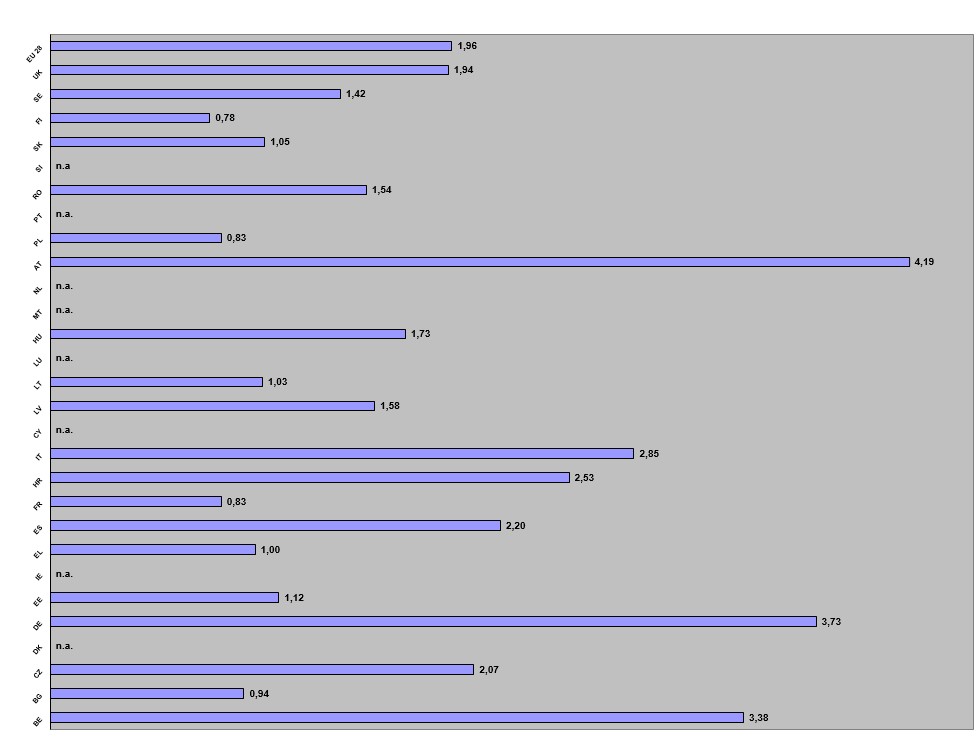
7.2 Road accidents involving personal injury per one thousand population in EU countries, 2018
Source : Eurostat and OECD
(*) The definition of an accident involving personal injury differs from country to country.
(**) The number of inhabitants used in this table is the sum of the population at 1 January 2017 and at 1 January 2018 divided by two.
7.3 Road fatalities in EU countries, 2009-2018
| Country | 2009 | 2010 | 2011 | 2012 | 2013 | 2014 | 2015 | 2016 | 2017 | 2018 | evolution 2017/201918 | evolution 2009/2018 |
| BE | 944 | 850 | 862 | 770 | 764 | 745 | 762 | 670 | 609 | 604 | -0,82 | -36,02 |
| BG | 901 | 776 | 656 | 601 | 601 | 661 | 708 | 708 | 682 | 610 | -10,56 | -32,30 |
| CZ | 901 | 802 | 773 | 742 | 654 | 688 | 734 | 611 | 577 | 656 | 13,69 | -27,19 |
| DK | 303 | 255 | 220 | 167 | 191 | 182 | 178 | 211 | 175 | 171 | -2,29 | -43,56 |
| DE | 4.152 | 3.648 | 4.009 | 3.600 | 3.339 | 3.377 | 3.459 | 3.206 | 3.180 | 3.275 | 2,99 | -21,12 |
| EE | 98 | 79 | 101 | 87 | 81 | 78 | 67 | 71 | 48 | 67 | 39,58 | -31,63 |
| IE | 238 | 212 | 186 | 162 | 188 | 193 | 162 | 182 | 156 | 142 | -8,97 | -40,34 |
| EL | 1.456 | 1.258 | 1.141 | 988 | 879 | 795 | 793 | 824 | 731 | 700 | -4,24 | -51,92 |
| ES | 2.687 | 2.444 | 2.042 | 1.889 | 1.667 | 1.680 | 1.689 | 1.810 | 1.830 | 1.806 | -1,31 | -32,79 |
| FR | 4.273 | 3.992 | 3.963 | 3.653 | 3.268 | 3.384 | 3.459 | 3.471 | 3.444 | 3.246 | -5,75 | -24,03 |
| HR | 548 | 426 | 418 | 393 | 368 | 308 | 348 | 307 | 331 | 317 | -4,23 | -42,15 |
| IT | 4.237 | 4.114 | 3.860 | 3.753 | 3.401 | 3.381 | 3.428 | 3.283 | 3.378 | 3.334 | -1,30 | -21,31 |
| CY | 71 | 60 | 71 | 51 | 44 | 45 | 57 | 46 | 53 | 49 | -7,55 | -30,99 |
| LV | 254 | 218 | 179 | 177 | 179 | 212 | 188 | 158 | 136 | 148 | 8,82 | -41,73 |
| LT | 370 | 299 | 296 | 302 | 256 | 267 | 242 | 192 | 191 | 173 | -9,42 | -53,24 |
| LU | 48 | 32 | 33 | 34 | 45 | 35 | 36 | 32 | 25 | 36 | 44,00 | -25,00 |
| HU | 822 | 740 | 638 | 605 | 591 | 626 | 644 | 607 | 625 | 633 | 1,28 | -22,99 |
| MT | 15 | 13 | 16 | 9 | 17 | 10 | 11 | 23 | 19 | 18 | -5,26 | 20,00 |
| NL | 644 | 537 | 546 | 562 | 476 | 476 | 531 | 533 | 535 | 598 | 11,78 | -7,14 |
| AT | 633 | 552 | 523 | 531 | 455 | 430 | 479 | 432 | 414 | 409 | -1,21 | -35,39 |
| PL | 4.572 | 3.908 | 4.189 | 3.571 | 3.357 | 3.202 | 2.938 | 3.026 | 2.831 | 2.862 | 1,10 | -37,40 |
| PT | 823 | 937 | 891 | 718 | 637 | 638 | 593 | 563 | 602 | 704 | 16,94 | -14,46 |
| RO | 2.796 | 2.377 | 2.018 | 2.042 | 1.861 | 1.818 | 1.893 | 1.913 | 1.951 | 1.867 | -4,31 | -33,23 |
| SI | 171 | 138 | 141 | 130 | 125 | 108 | 120 | 130 | 104 | 91 | -12,50 | -46,78 |
| SK | 384 | 371 | 325 | 352 | 251 | 295 | 310 | 275 | 276 | 260 | -5,80 | -32,29 |
| FI | 279 | 272 | 292 | 255 | 258 | 229 | 270 | 258 | 238 | 239 | 0,42 | -14,34 |
| SE | 358 | 266 | 319 | 285 | 260 | 270 | 259 | 270 | 253 | 324 | 28,06 | -9,50 |
| UK | 2.337 | 1.905 | 1.960 | 1.802 | 1.770 | 1.854 | 1.804 | 1.860 | 1.856 | 1.839 | -0,92 | -21,31 |
| EU 28 | 35.315 | 31.481 | 30.668 | 28.231 | 25.983 | 25.987 | 26.162 | 25.672 | 25.250 | 25.178 | -0,29 | -28,70 |
Source : Eurostat
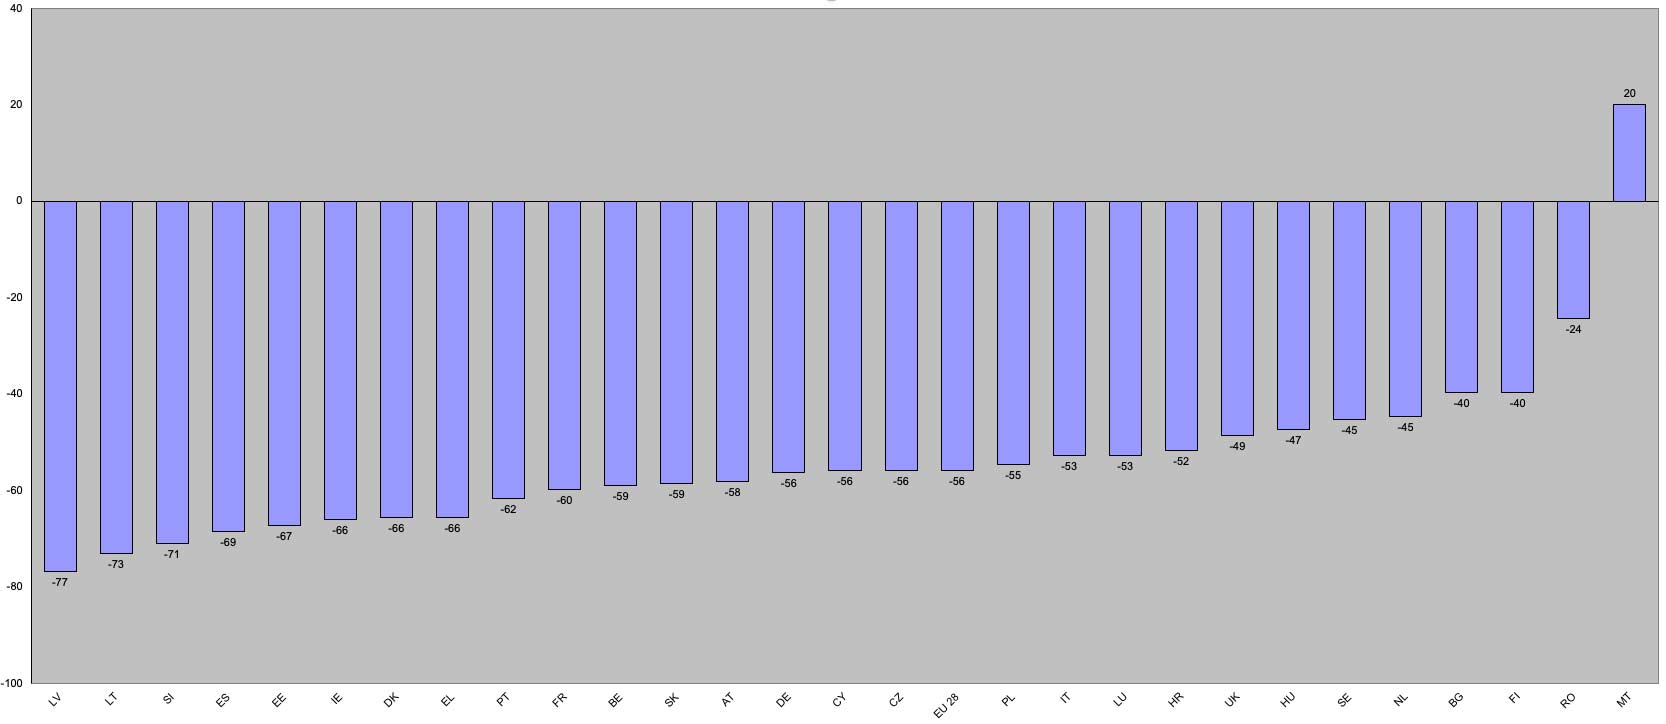
7.4 Percentage change in road fatalities between 2000 and 2018 (%)
Source : Eurostat
7.5 Road fatalities country rankings, 2017
| Fatalities | |||||||||||||
| 2017 | |||||||||||||
| per million inhabitants | per 10 billion pkm | per million passenger cars | |||||||||||
| SE | 25 | SE | 22 | SE | 53 | ||||||||
| UK | 28 | UK | 27 | UK | 58 | ||||||||
| DK | 30 | IE | 28 | LU | 63 | ||||||||
| NL | 31 | DK | 29 | NL | 64 | ||||||||
| IE | 32 | LU | 32 | MT | 66 | ||||||||
| EE | 36 | DE | 33 | EE | 67 | ||||||||
| DE | 38 | FI | 35 | DE | 69 | ||||||||
| ES | 39 | EE | 35 | DK | 70 | ||||||||
| MT | 41 | SI | 38 | FI | 70 | ||||||||
| LU | 42 | NL | 38 | IE | 75 | ||||||||
| FI | 43 | IT | 43 | ES | 79 | ||||||||
| AT | 47 | FR | 45 | AT | 85 | ||||||||
| EU-28 | 49 | AT | 49 | IT | 88 | ||||||||
| SI | 50 | EU-28 | 50 | SI | 94 | ||||||||
| SK | 51 | ES | 53 | EU-28 | 96 | ||||||||
| FR | 52 | BE | 57 | CY | 102 | ||||||||
| BE | 54 | LT | 59 | CZ | 106 | ||||||||
| CZ | 54 | PT | 64 | BE | 107 | ||||||||
| IT | 56 | EL | 68 | FR | 107 | ||||||||
| PT | 58 | MT | 70 | PT | 121 | ||||||||
| CY | 62 | CZ | 74 | SK | 127 | ||||||||
| HU | 64 | CY | 79 | PL | 128 | ||||||||
| LT | 68 | LV | 87 | EL | 139 | ||||||||
| EL | 68 | SK | 94 | LT | 144 | ||||||||
| LV | 70 | HU | 101 | HU | 184 | ||||||||
| PL | 75 | BG | 115 | LV | 201 | ||||||||
| HR | 80 | HR | 125 | HR | 210 | ||||||||
| BG | 96 | PL | 135 | BG | 231 | ||||||||
| RO | 100 | RO | 192 | RO | 340 | ||||||||
Source : tables 1.5, 2.3.4, 2.6.2, 2.7.1 and estimates as well as national statistics for powered two-wheelers pkm
Fatalities: all fatalities on the road: car drivers and passengers, bus and coach occupants, powered two-wheelers’ riders and passengers, cyclists, pedestrians, commercial vehicle drivers, etc. indicated in table 2.7.1
Pkm: indicator of traffic volume (in the absence of consistent vehicle-kilometre data); passenger-kilometres of cars indicated in table 2.3.4 for 2017 plus (mostly estimated) passenger-kilometres of motorised two-wheelers.
Inhabitants: the average population at 1 January 2017 and 1 January 2018.
Passenger cars: the average stock of vehicles indicated in table 2.6.2 for 2016 and 2017.
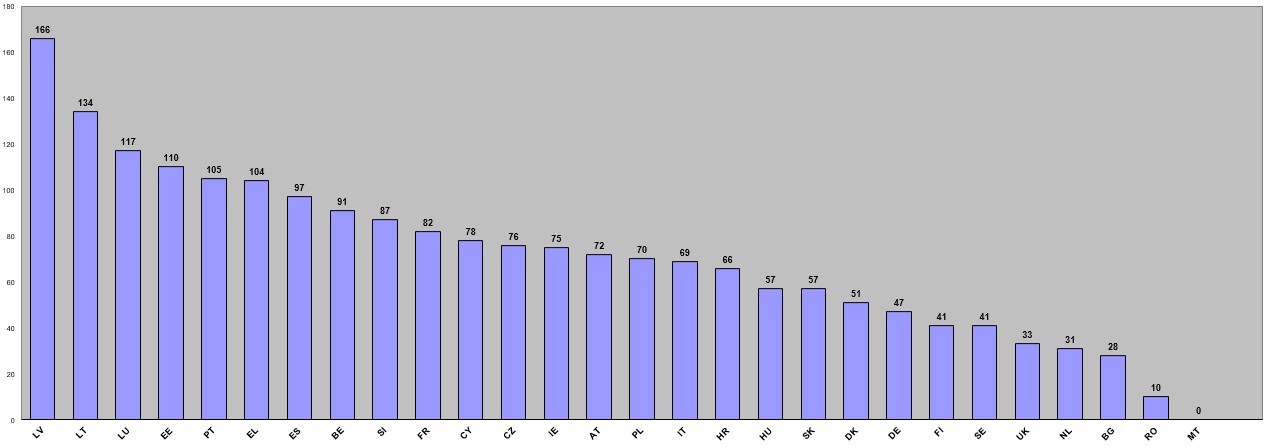
7.6 Lives saved per million inhabitants in EU countries in 2017 (compared to 2001)
Source : EC, OECD
7.7 Evolution of road fatalities and injured in EU 28, 2003-2018
| Road Fatalities | Injuries | |
| 2003 | 50.992 | 1.405.501 |
| 2004 | 47.892 | 1.358.707 |
| 2005 | 45.951 | 1.330.187 |
| 2006 | 43.743 | 1.333.543 |
| 2007 | 43.169 | 1.330.043 |
| 2008 | 39.611 | 1.266.201 |
| 2009 | 35.282 | 1.220.066 |
| 2010 | 31.541 | 1.149.874 |
| 2011 | 30.754 | 1.147.088 |
| 2012 | 28.346 | 1.104.802 |
| 2013 | 26.047 | 1.073.246 |
| 2014 | 26.042 | 1.089.465 |
| 2015 | 26.201 | 1.095.486 |
| 2016 | 25700 | 1102822 |
| 2017 | 25079 | 1080325 |
| 2018 | 24180 | 1014599 |
Source : OECD
(*) No data for CY
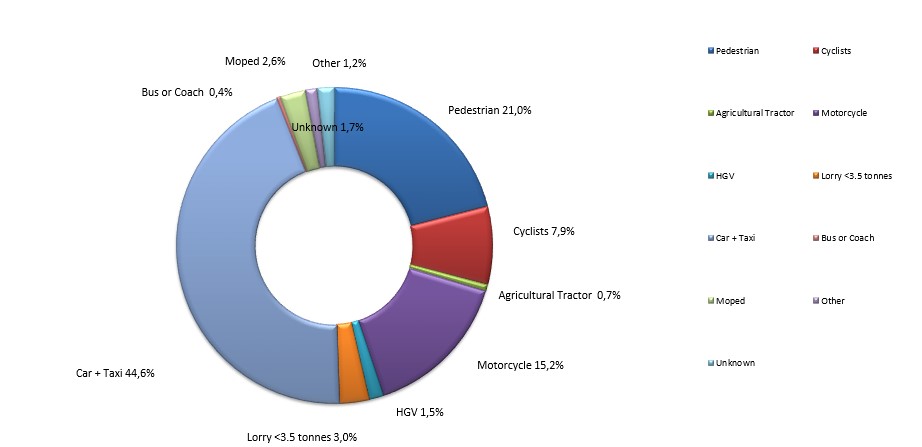
7.8 Road fatalities by mode of transport in EU 28 2018
7.9 PTWs fatalities in selected EU countries, 2017 (%)
| motor cycle | moped | Total fatalities | motor cycle % | moped % | |||
| BE | 2017 | 77 | 24 | 520 | BE | 14,8 | 4,6 |
| BG | 2017 | 2 | 11 | 525 | BG | 0,4 | 0,6 |
| CZ | 2017 | 69 | 2 | 448 | CZ | 15,4 | 0,4 |
| DK | 2017 | 11 | 9 | 155 | DK | 7,1 | 5,8 |
| DE | 2017 | 583 | 59 | 2691 | DE | 21,7 | 2,2 |
| EE | 2017 | 0 | 1 | 38 | EE | 0,0 | 2,6 |
| IE | 2017 | 20 | 0 | 128 | IE | 15,6 | 0,0 |
| EL | 2017 | 216 | 32 | 613 | EL | 35,2 | 5,2 |
| ES | 2017 | 359 | 49 | 1479 | ES | 24,3 | 3,3 |
| FR | 2017 | 669 | 117 | 2964 | FR | 22,6 | 3,9 |
| HR | 2017 | 42 | 8 | 275 | HR | 15,3 | 2,9 |
| IT | 2017 | 735 | 92 | 2778 | IT | 26,5 | 3,3 |
| CY | 2017 | 14 | 2 | 38 | CY | 36,8 | 5,3 |
| LV | 2017 | 1 | 6 | 85 | LV | 1,2 | 7,1 |
| LT | 2017 | 10 | 3 | 124 | LT | 8,1 | 2,4 |
| LU | 2017 | 7 | 0 | 21 | LU | 33,3 | 0,0 |
| HU | 2017 | 43 | 17 | 455 | HU | 9,5 | 3,7 |
| MT | 2017 | 1 | 0 | 12 | MT | 8,3 | 0,0 |
| NL | 2017 | 53 | 36 | 471 | NL | 11,3 | 7,6 |
| AT | 2017 | 83 | 14 | 341 | AT | 24,3 | 4,1 |
| PL | 2017 | 231 | 55 | 1958 | PL | 11,8 | 2,8 |
| PT | 2017 | 106 | 43 | 472 | PT | 22,5 | 9,1 |
| RO | 2017 | 52 | 17 | 1218 | RO | 4,3 | 1,4 |
| SI | 2017 | 25 | 4 | 94 | SI | 26,6 | 4,3 |
| SK | 2017 | 0 | 8 | 196 | SK | 0,0 | 4,1 |
| FI | 2017 | 13 | 5 | 211 | FI | 6,2 | 2,4 |
| SE | 2017 | 39 | 1 | 216 | SE | 18,1 | 0,5 |
| UK | 2017 | 355 | 3 | 1371 | UK | 25,9 | 0,2 |
Source : CARE database (DG Mobility and Transport), national sources.
(*) Persons deceased within 30 days of their accident.
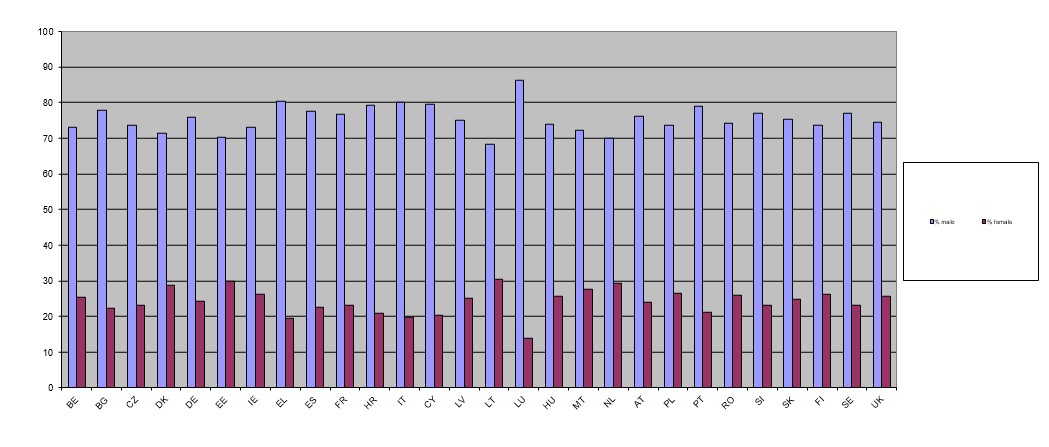
7.10 Road fatalities by gender in EU countries, 2018 (%)
Source : Eurostat
(*) LT 2015 figures
PL, PT 2017 figures
SK 2010 figures
IE 2016 figures
| Country | % male | % female | Total | Unknown* | Female | Male | Year |
| BE | 73,18 | 25,33 | 604 | : | 153 | 442 | 2018 |
| BG | 77,69 | 22,31 | 610 | 9 | 158 | 451 | 2018 |
| CZ | 73,48 | 23,02 | 656 | 1 | 151 | 482 | 2018 |
| DK | 71,35 | 28,65 | 171 | 23 | 49 | 122 | 2018 |
| DE | 75,73 | 24,27 | 3275 | 0 | 795 | 2480 | 2018 |
| EE | 70,15 | 29,85 | 67 | 0 | 20 | 47 | 2018 |
| IE | 73,08 | 26,37 | 182 | 0 | 48 | 133 | 2016 |
| EL | 80,43 | 19,57 | 700 | : | 137 | 563 | 2018 |
| ES | 77,46 | 22,54 | 1806 | 0 | 407 | 1399 | 2018 |
| FR | 76,74 | 23,26 | 3246 | 0 | 755 | 2491 | 2018 |
| HR | 79,18 | 20,82 | 317 | 0 | 66 | 251 | 2018 |
| IT | 80,17 | 19,83 | 3334 | 0 | 661 | 2673 | 2018 |
| CY | 79,59 | 20,41 | 49 | 0 | 10 | 39 | 2018 |
| LV | 75,00 | 25,00 | 148 | 0 | 37 | 111 | 2018 |
| LT | 68,18 | 30,58 | 242 | 3 | 74 | 165 | 2015 |
| LU | 86,11 | 13,89 | 36 | : | 5 | 31 | 2018 |
| HU | 73,78 | 25,75 | 633 | 0 | 163 | 467 | 2018 |
| MT | 72,22 | 27,78 | 18 | 3 | 5 | 13 | 2018 |
| NL | 70,07 | 29,43 | 598 | 0 | 176 | 419 | 2018 |
| AT | 76,04 | 23,96 | 409 | 3 | 98 | 311 | 2018 |
| PL | 73,61 | 26,39 | 2831 | 0 | 747 | 2084 | 2017 |
| PT | 78,90 | 21,10 | 602 | 0 | 127 | 475 | 2017 |
| RO | 74,18 | 25,82 | 1867 | : | 482 | 1385 | 2018 |
| SI | 76,92 | 23,08 | 91 | 0 | 21 | 70 | 2018 |
| SK | 75,20 | 24,80 | 371 | 0 | 92 | 279 | 2010 |
| FI | 73,64 | 26,36 | 239 | : | 63 | 176 | 2018 |
| SE | 76,85 | 23,15 | 324 | 0 | 75 | 249 | 2018 |
| UK | 74,33 | 25,67 | 1839 | 0 | 472 | 1367 | 2018 |
(*) Unknown means that gender or/and road user type variable is unknown
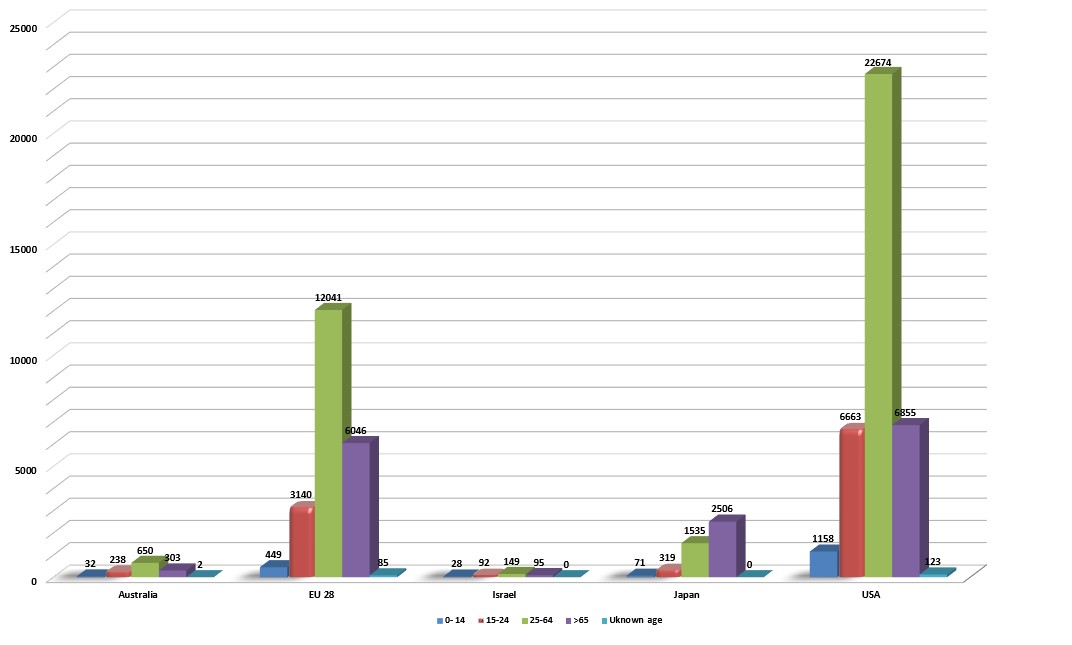
7.11 Road fatalities by age group in EU 28* and selected countries, 2017
Source : IRTAD
(*) No data for BG, EE, HR, CY, LV, MT, RO and SK.
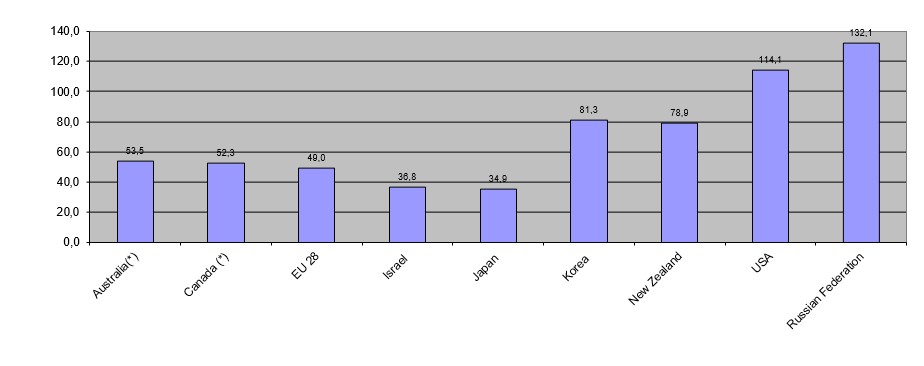
7.12 Road Fatalities (per one million inhabitants) in EU 28 and selected countries, 2017
Source : OECD
7.13 Speed limits, blood alcohol limits in EU 28
| Speed limit, cars (in general), km/h: | Blood alcohol limit, grams of alcohol in 1 litre of blood | |||
| Built-up areas | Outside built-up areas | Motorways | ||
| BE | 50 | 70-90-120 | 120 | 0,5 |
| BG | 50 | 90-120 | 140 | 0 |
| CZ | 50 | 90-110 | 130 | 0 |
| DK | 50 | 80 | 130 | 0,5 |
| DE | 50 | 100 | (130) | 0,5 |
| EE | 50 | 90 | – | 0,2 |
| IE | 50 | 80-100 | 120 | 0,5 |
| EL | 50 | 90-110 | 130 | 0,5 |
| ES | 50 | 90-100 | 120 | 0,5 |
| FR | 50 | 90-110 | 130 | 0,5 |
| HR | 50 | 90 | 130 | 0,5 |
| IT | 50 | 90 | 130 | 0,5 |
| CY | 50 | 80 | 100 | 0,5 |
| LV | 50 | 90 | – | 0,5 |
| LT | 50 | 70-90 | 100-130 | 0,4 |
| LU | 50 | 90 | 130 | 0,5 |
| HU | 50 | 90-110 | 130 | 0 |
| MT | 50 | 80 | – | 0,8 |
| NL | 50 | 80-100 | 120-130 | 0,5 |
| AT | 50 | 100 | 130 | 0,5 |
| PL | 50-60 | 90-100 | 120-140 | 0,2 |
| PT | 50 | 90-100 | 120 | 0,5 |
| RO | 50 | 90-100 | 130 | 0 |
| SI | 50 | 90-110 | 130 | 0,5 |
| SK | 50 | 90 | 130 | 0 |
| FI | 50 | 80 | 80-120 | 0,22 |
| SE | 50 | 70 | 110 | 0,2 |
| UK | 48 | 96-112 | 112 | 0,8 |
| AL | 40 | 80-90 | 110 | 0,1 |
| ME | 50 | 80-100 | 130 | 0,5 |
| MK | 60 | 80-100 | 120 | 0,5 |
| RS | 50 | 80-100 | 120 | 0,3 |
| TR | 50 | 90-110 | 120 | 0,5 |
| IS | 50 | 80-90 | – | 0,5 |
| NO | 50 | 80 | 100 | 0,2 |
| CH | 50 | 80-100 | 120 | 0,5 |
Source : National sources, International Transport Forum, EC Road Safety website, TIPSOL, World Health Organization.
(*) UK, IE, CY and MT drive on the left hand side of the road, the other Member States drive on the right hand side (Sweden since 3 September 1967). Signs in UK are in miles per hour.
(**) The reported speed limits refer to general circumstances. Different speed limits might apply in residential or pedestrian areas, on the basis of weather conditions, the time of the day, the vehicle driven, the season, the visibility or unless otherwise stated by traffic signs. The higher figure shown in the “outside built-up areas” column generally refers to the speed limit on dual carriageways that are not motorways.
Speed limits:
BE: 70 km/h outside built-up areas in the Flemish Region.
DE: Motorways: No general speed limit, recommended speed limit is 130 km/h (more than half the network has a speed limit of 120 km/h or less).
ES: different speed limits apply on non-urban roads according to the presence of hard shoulders, or if the vehicle is equipped with a trailer or dangerous goods.
Blood alcohol limits:
In many countries, special (more restrictive) rules apply to novice (i.e. new, unexperienced) and professional drivers
7.14 Fatalities at 30 days by road user type in EU countries 2018 *
Source : Eurostat
(*) IE 2016 data, LT 2015 data, PL and PT 2017 data, SK 2010 data
7.15 Fatalities at 30 days by road type in EU countries 2018 *
Source : Eurostat
(*) IE 2016 data, EE, LT, LV and MT no data PL and PT 2017 data, SK 2010 data

