3.1 Toll net revenues in selected countries, 2010-2018 (EUR million)
| 2010 | 2011 | 2012 | 2013 | 2014 | 2015 | 2018 | ||
| DK | 454,0 | 472.00 | 492,0 | 507,0 | 537,0 | 559,0 | 576 | DK |
| EL | 565,0 | 530.00 | 516,0 | 516,0 | 469,0 | 495,0 | 659,61 | EL |
| ES | 1820,6 | 1,808.7 | 1623,8 | 1565,0 | 1608,6 | 1709,3 | 1826,23 | ES |
| FR | 7775,6 | 8,442.6 | 8450,0 | 9170 (1) | 9222,4 | 9160,0 | 10.223,00 | FR |
| IE | 184,0 | 184.00 | 193,0 | 200,0 | 217,0 | 217,0 | 217 | IE |
| IT | 4835,9 | 4,971.00 | 4804,5 | 4914,0 | 5176,9 | 5454,9 | 6.151,51( | IT |
| NL | 27.21 | 28.49 | 26,8 | 26,5 | 27,7 | 28,3 | 35,4 | NL |
| AT | 1,535.50 | 1,561.00 | 1622,1 | 1687,0 | 1826,0 | 1840,0 | 2.156,00 | AT |
| PT | 725.31 | 693.43 | 627,8 | 812,5 | 855,4 | 915,6 | 1.113,89 | PT |
| HU | 145.50 | 167.90 | 167,9 | 189,2 | 677,6 | 677,6 | 755,6 | HU |
| SI | 290.10 | 298.34 | 294,9 | 305,0 | 344,2 | 349,9 | 451,5 | SI |
| HR | 267.40 | 272.34 | 282,8 | 296,69 (2) | 297,1 | 317,3 | 406,15 | HR |
| PL | 189.3 | 148.25 | 157,0 | 179,6 (3) | 185,9 | 209,0 | 270 | PL |
| UK | 70.1 | 64.40 | 71,6 | 77,6 | 83,3 | 102,0 | 101,35 | UK |
| CZ | 262.8 | 325.00 | 346,5 | 342,2 (4) | 316,0 | 360,2 | 419 | CZ |
| DE | 4,484.00 | 4,498.00 | 4364,0 | 4400,0 | 4460,0 | 4370,0 | 5.165,90 | DE |
| RF | – | – | – | 29,3 | 75,2 | 55,5 | – | RF |
| SK | 175.3 | 199.88 | 151,3 | 158,63 (5) | 113,7 | 119,6 | 289,68 | SK |
Source : ASECAP
Data at 31.12.2018
3.2 CEF transport budgets comparison (in commitments; € billions)
Source : EP
3.3 European Investment Bank Loans for Transport to EU 28, 2015-2019 (EUR million)
| 2019 | 2014-2018 | |
| Roads, Motorways | 1472 | 11056 |
| Railways | 3186 | 17906 |
| Urban Transport | 2708 | 13725 |
| Air Transport | 1263 | 4504 |
| Sea Transport | 534 | 2865 |
| Intermodal Freight Terminals and Other | n.a. | 91 |
| Sundry Transport Infrastructure | 11 | 11 |
| Other form of transport | 25 | 40 |
| Space Transport | 100 | 100 |
| Transport | 28 | 158 |
| Total Transport Sector | 9.327 | 50.456 |
Source : EIB
3.4 European Investment Bank Loans for Transport to EU 28, 2019 (total € 9 327 million)
Source : EIB
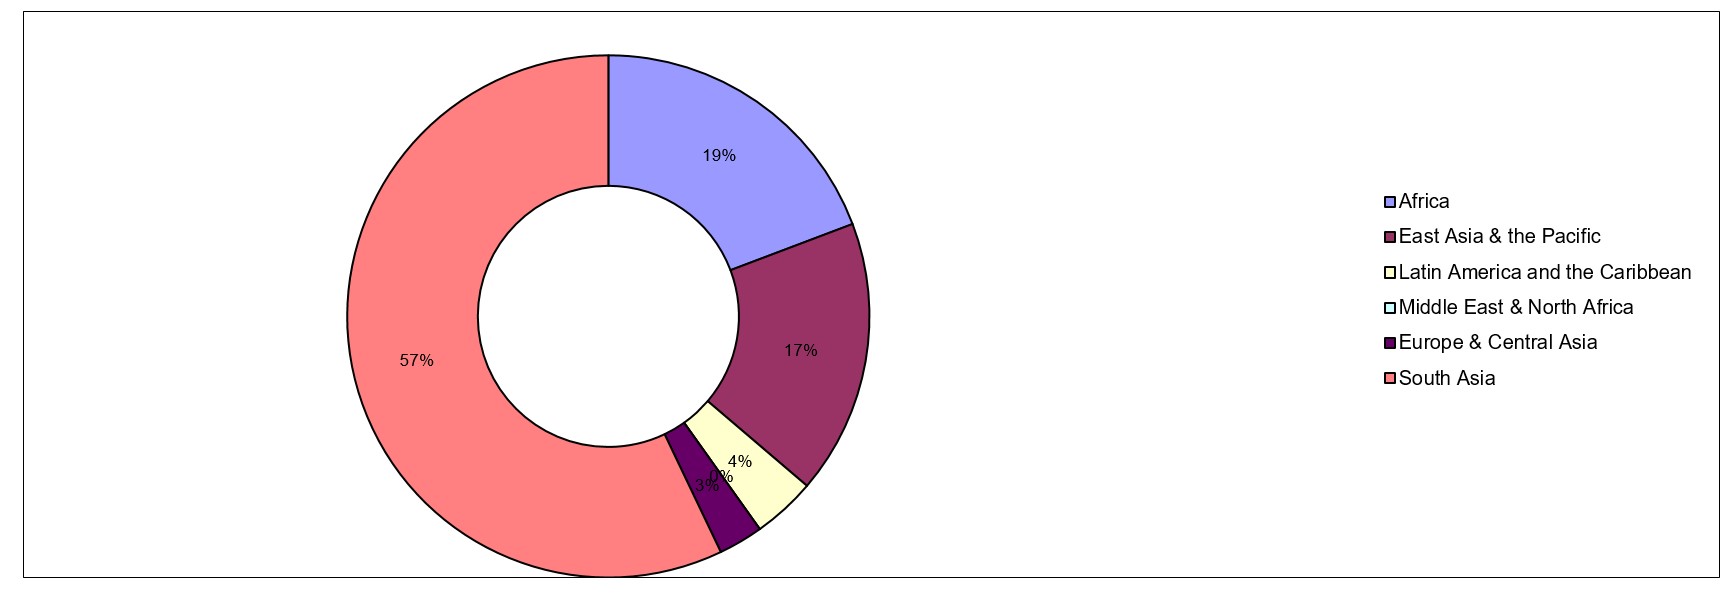
3.6 Transport Lending Breakdown by Region, 2019 (total $ 3,12 billion)
Source : World Bank


