Covid-19 has spread rapidly around the world to become a global health crisis. Severe restrictions have been put in place to contain the virus and avoid the collapse of health care systems in many countries. One result of the efforts to contain the pandemic has been a dramatic reduction in transport activity. All transport modes have been affected by the pandemic: hereunder some figures concerning the road transport. During the confinement period, roads have ensured that the supply of necessary goods (food, medicine, medical equipment…) keep on being timely and properly delivered to the population, also guaranteeing mobility for emergency services (ambulances, fire brigades, technical urgent interventions, and assistance), including to the most remote areas.From this point of view, the road infrastructure has demonstrated its great capacity for adaptation and flexibility by very quickly allowing a change of allocation of the road network and by providing the rapid implementation of effective solutions.
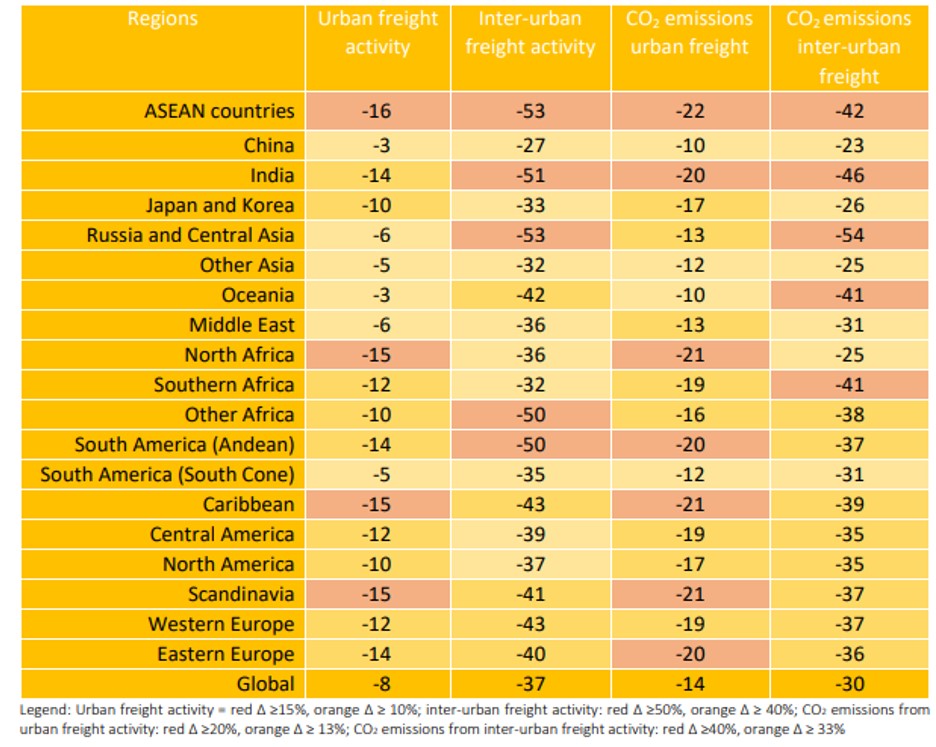
10.1 Projected Covid-19 impact on freight and associated CO2 emissions for 2020
Source : ITF
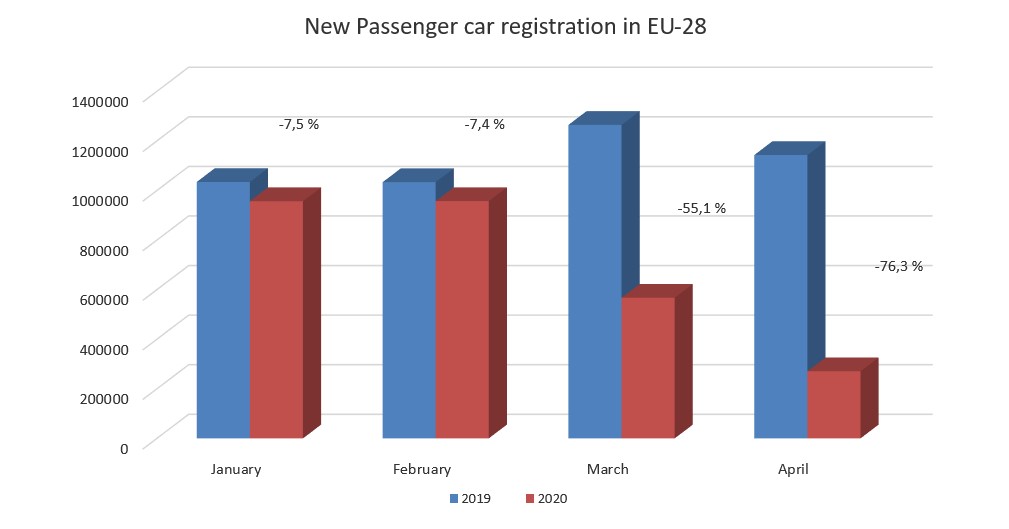
10.2 New passenger car registration : comparison first quarter 2019 and 2020
Source : ACEA
10.3 EU deliveries of Oil products : comparison february and march 2020 EU*
Source : Eurostat
(*) EU aggregates include 25 Member States as data are not available for Greece and Estonia.
10.4 EU deliveries of Oil Products : comparison February/march 2020 in EU countries *
| LPG | Gasoline | Kerosenses | Gas/Diesel | Fuel Oil | |
| European Union | 1,5 | -14,9 | -26,7 | 0,6 | 5,0 |
| BE | 8,2 | -17,9 | -8,0 | 24,3 | 4,4 |
| BG | -5,9 | 39,3 | -57,1 | 33,3 | 166,7 |
| CZ | -11,4 | -11,1 | -44,4 | -1,6 | 40,0 |
| DK | 25,0 | -3,2 | -35,7 | 10,3 | -212,5 |
| DE | 12,7 | -2,9 | -19,7 | 12,3 | -7,0 |
| IE | 5,9 | -10,5 | 18,8 | 4,4 | 25,0 |
| ES | 13,9 | -33,3 | -34,6 | -10,6 | 7,6 |
| FR | 7,9 | -20,2 | -27,7 | -4,4 | -6,3 |
| HR | -18,2 | -3,1 | 0,0 | -2,8 | -33,3 |
| IT | -26,9 | -39,7 | -52,0 | -26,0 | -2,2 |
| CY | -25,0 | -24,0 | -38,9 | -16,0 | -18,8 |
| LV | -50,0 | -37,5 | -11,1 | ||
| LT | -8,3 | -11,1 | -40,0 | 11,1 | 5,9 |
| LU | 0,0 | -13,0 | 25,8 | -6,2 | |
| HU | 5,1 | -9,6 | -42,1 | 3,3 | 0,0 |
| MT | -33,3 | -33,3 | -66,7 | -21,5 | 35,1 |
| NL | -11,5 | -18,6 | -13,8 | 15,1 | -3,5 |
| AT | -42,9 | -19,5 | -39,7 | 3,2 | -25,0 |
| PL | -2,0 | -8,6 | -42,7 | 10,3 | -16,7 |
| PT | 41,1 | -17,7 | -30,8 | -9,2 | -7,3 |
| RO | 2,4 | 11,7 | -87,5 | 5,5 | -28,6 |
| SI | 12,5 | -14,3 | 0,0 | -8,3 | 8,3 |
| SK | 14,3 | -15,9 | -33,3 | -8,3 | 9,5 |
| FI | 13,2 | -5,9 | -20,6 | 18,6 | 25,0 |
| SE | 42,6 | 9,1 | -56,8 | 14,9 | 75,2 |
Source : Eurostat
(*) EU aggregates include 25 Member States as data are not available for Greece and Estonia.
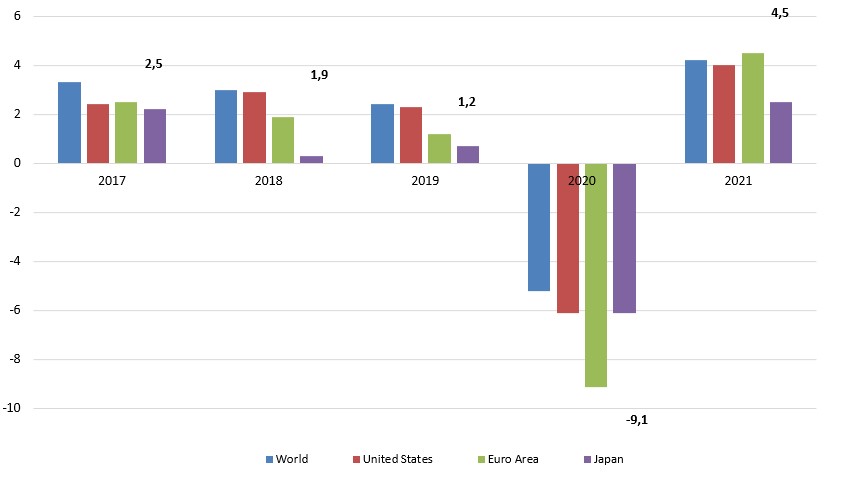
10.5 GDP Changes comparison and estimation
Source : World Bank
(*) 2019 estimate and 2020, 2021 forecast.World Bank forecasts are frequently updated based on new information. Consequently, projections presented here may differ from those contained in other World Bank documents, even if basic assessments of countries’ prospects do not differ at any given moment in time.
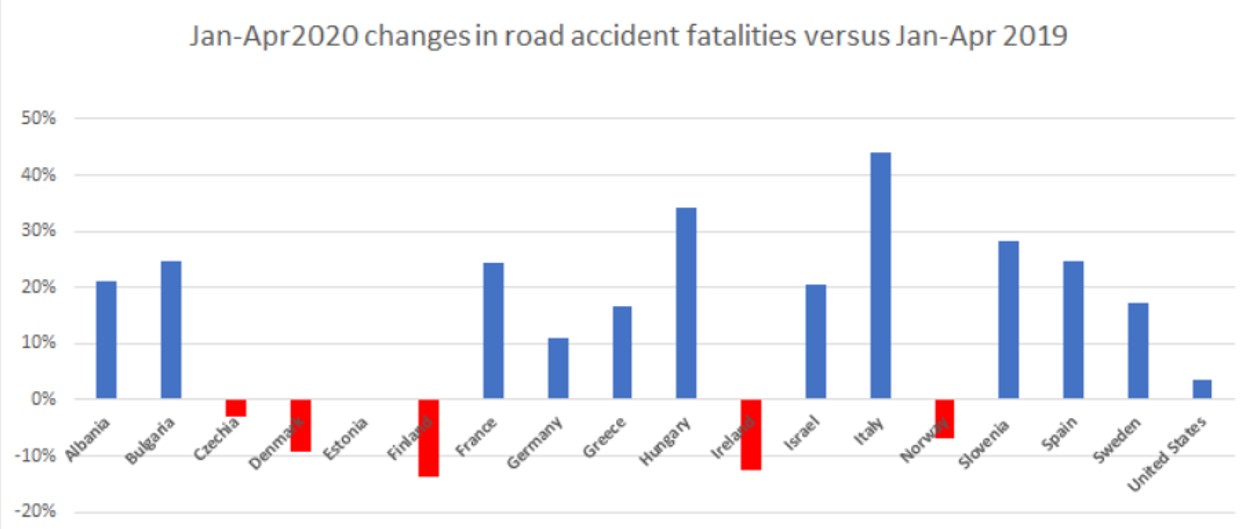
10.6 Changes in road safety fatalities in selected countries, January-April 2020 versus the same time period of 2019
Source : UNECE Data wiki , A positive value refers to a decrease compared to 2019.


