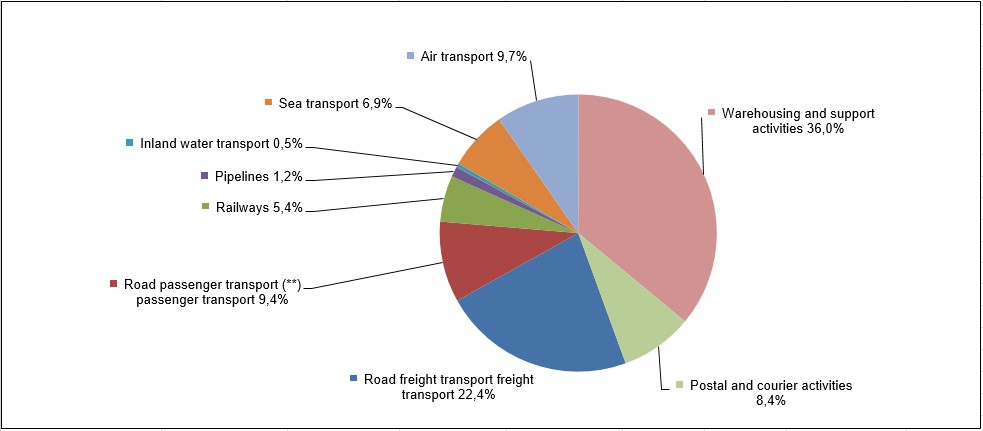
1.1 Percentage of turnover by mode of transport in EU 28, 2016 total €1.501 million EUR)*
Source : Eurostat
(*) Data refer to transportation and storage activities (including postal and courier services, removal services). The values above in italics are not from ESTAT or other official source, but are merely indicative estimates made by DG MOVE.
(**) Including all urban and suburban land transport modes (motor bus, tramway, streetcar, trolley bus, underground and elevated railways)
The above figures refer to those companies whose main activity lies in the mode concerned.
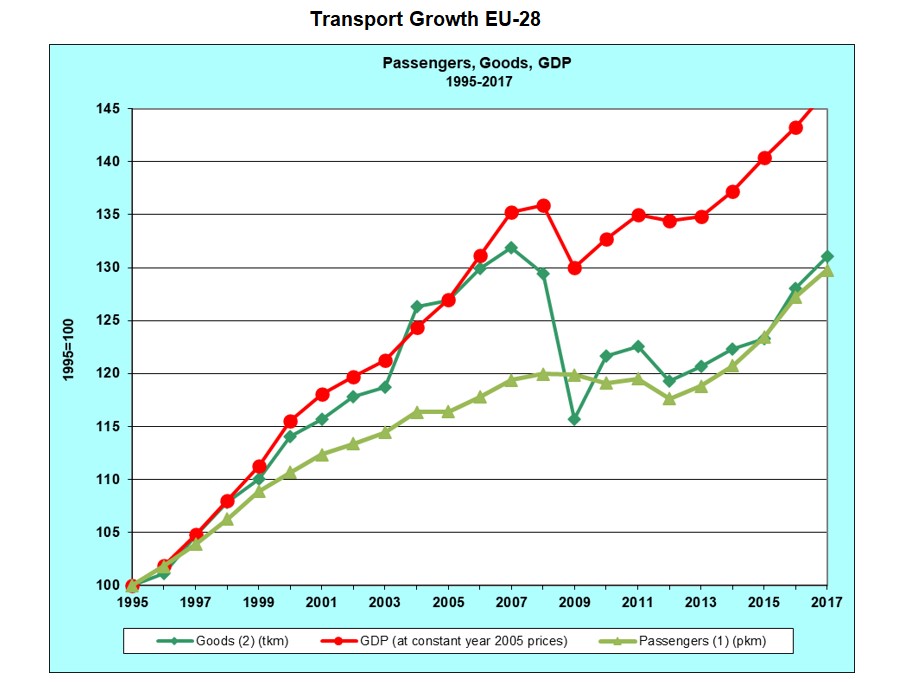
1.2 Transport growth in EU 28, evolution 1995-2017
Source: Eurostat, tables 2.2.2 and 2.3.2
Notes :
(1) : passenger cars, powered two-wheelers, buses & coaches, tram & metro, railways, intra-EU air, intra-EU sea
(2) : road, rail, inland waterways, oil pipelines, intra-EU air, intra-EU sea
GDP: at constant year 2005 prices and exchange rates
1.3 Annual growth rates EU 28 (% change)
| 1995-2016 p.a. | 2000-2016 p.a. | 2015-2016 | |||
| GDP at year 2005 prices and exchange rates | 1,8% | 1,4% | 2,5% | ||
| Passenger transport | 1,2% | 0,8% | 2,4% | ||
| (pkm) | |||||
| Freight transport | 1,2% | 0,9% | 2,0% | ||
| (tkm) | |||||
Source: EC
1.4 Employment by mode of transport in EU countries, 2016 (thousand)
| Total | Road | Road | Railways | Pipelines | Inland water transport | Sea transport | Air transport | Warehousing and support | Postal and courier activities | ||
| freight transport | passenger transport (**) | ||||||||||
| EU-28 | 11 328,3 | 3 235,1 | 2 075,2 | 660,7 | 29,1 | 43,2 | 176,2 | 366,7 | 2 909,1 | 1 833,0 | EU-28 |
| BE | 211,4 | 59,8 | 18,8 | 34,1 | 1,0 | 0,9 | 1,0 | 5,9 | 56,1 | 33,9 | BE |
| BG | 169,3 | 69,1 | 32,0 | 11,0 | 0,3 | 0,9 | 0,7 | 2,1 | 33,1 | 20,1 | BG |
| CZ | 279,8 | 125,4 | 38,3 | 27,0 | 0,3 | 0,4 | 0,2 | 2,3 | 45,9 | 40,0 | CZ |
| DK | 146,8 | 30,0 | 25,9 | 6,2 | 0,3 | 0,2 | 19,2 | 5,5 | 30,1 | 29,5 | DK |
| DE | 2 341,9 | 433,5 | 448,8 | 47,5 | 3,4 | 10,5 | 21,3 | 66,0 | 753,4 | 557,5 | DE |
| EE | 38,2 | 16,1 | 3,3 | 1,4 | 0,0 | 0,0 | 0,9 | 0,2 | 13,0 | 3,4 | EE |
| IE | 97,7 | 21,0 | 28,4 | 4,6 | 0,1 | 0,0 | 0,9 | 8,0 | 17,3 | 17,5 | IE |
| EL | 184,2 | 35,7 | 61,0 | 9,5 | 0,2 | 0,0 | 15,9 | 3,7 | 43,5 | 14,6 | EL |
| ES | 854,4 | 320,6 | 176,8 | 14,8 | 2,5 | 0,5 | 6,8 | 29,3 | 219,7 | 83,3 | ES |
| FR | 1 382,2 | 357,9 | 264,9 | 198,3 | 3,1 | 4,0 | 11,0 | 64,8 | 241,8 | 236,6 | FR |
| HR | 83,2 | 22,0 | 19,4 | 3,9 | 0,7 | 0,1 | 4,1 | 1,2 | 21,5 | 10,3 | HR |
| IT | 1 117,0 | 325,0 | 168,0 | 38,3 | 2,2 | 2,9 | 46,4 | 20,4 | 356,2 | 157,6 | IT |
| CY | 17,4 | 1,9 | 3,3 | 0,0 | 0,0 | 0,0 | 0,4 | 0,1 | 10,2 | 1,6 | CY |
| LV | 78,6 | 25,7 | 14,1 | 3,5 | 0,2 | 0,2 | 0,6 | 1,5 | 27,1 | 5,6 | LV |
| LT | 120,3 | 63,5 | 15,7 | 10,0 | 0,2 | 0,1 | 1,1 | 0,7 | 21,3 | 7,6 | LT |
| LU | 20,7 | 7,5 | 3,5 | 1,2 | 0,0 | 0,3 | 0,0 | 2,3 | 4,3 | 1,5 | LU |
| HU | 247,1 | 76,4 | 49,7 | 19,2 | 0,4 | 0,8 | 0,0 | 1,1 | 65,0 | 34,5 | HU |
| MT | 11,8 | 1,6 | 1,7 | 0,0 | 0,0 | 0,0 | 0,3 | 1,7 | 4,1 | 2,5 | MT |
| NL | 401,1 | 120,4 | 51,8 | 21,0 | 0,1 | 13,4 | 8,7 | 25,5 | 92,9 | 67,3 | NL |
| AT | 199,1 | 61,9 | 57,4 | 9,8 | 1,4 | 0,6 | 0,0 | 7,3 | 36,8 | 23,9 | AT |
| PL | 789,2 | 356,8 | 136,3 | 49,0 | 4,0 | 1,4 | 2,1 | 4,4 | 143,5 | 91,9 | PL |
| PT | 159,9 | 67,0 | 33,4 | 0,7 | 0,0 | 0,7 | 1,0 | 11,4 | 31,0 | 14,7 | PT |
| RO | 365,8 | 146,0 | 78,3 | 27,3 | 6,2 | 2,0 | 0,3 | 3,8 | 62,8 | 39,1 | RO |
| SI | 46,9 | 23,8 | 5,4 | 1,4 | 0,0 | 0,1 | 0,2 | 0,6 | 8,5 | 6,8 | SI |
| SK | 105,2 | 45,7 | 14,4 | 7,5 | 0,2 | 0,4 | 0,0 | 0,4 | 20,0 | 16,6 | SK |
| FI | 143,0 | 45,2 | 25,2 | 9,0 | 0,0 | 0,3 | 8,7 | 4,5 | 27,7 | 22,5 | FI |
| SE | 273,9 | 81,0 | 71,0 | 10,2 | 0,0 | 1,5 | 12,0 | 5,8 | 52,8 | 39,4 | SE |
| UK | 1 442,4 | 294,6 | 228,4 | 94,4 | 2,4 | 1,1 | 12,5 | 86,5 | 469,4 | 253,1 | UK |
Source: Eurostat, estimates
Notes:
(*) Data refer to transportation and storage activities (including postal and courier services, removal services). Data are based on Structural Business Statistics and therefore total transport employment differs from value on Overview 2.1.1. The values above in italics are not from ESTAT or other official source, but are merely indicative estimates made by DG MOVE.
(**) Including all urban and suburban land transport modes (motor bus, tramway, streetcar, trolley bus, underground and elevated railways)
The above figures refer to employment only in those companies whose main activity lies in the mode concerned. Economic activity according to NACE Rev. 2 classification
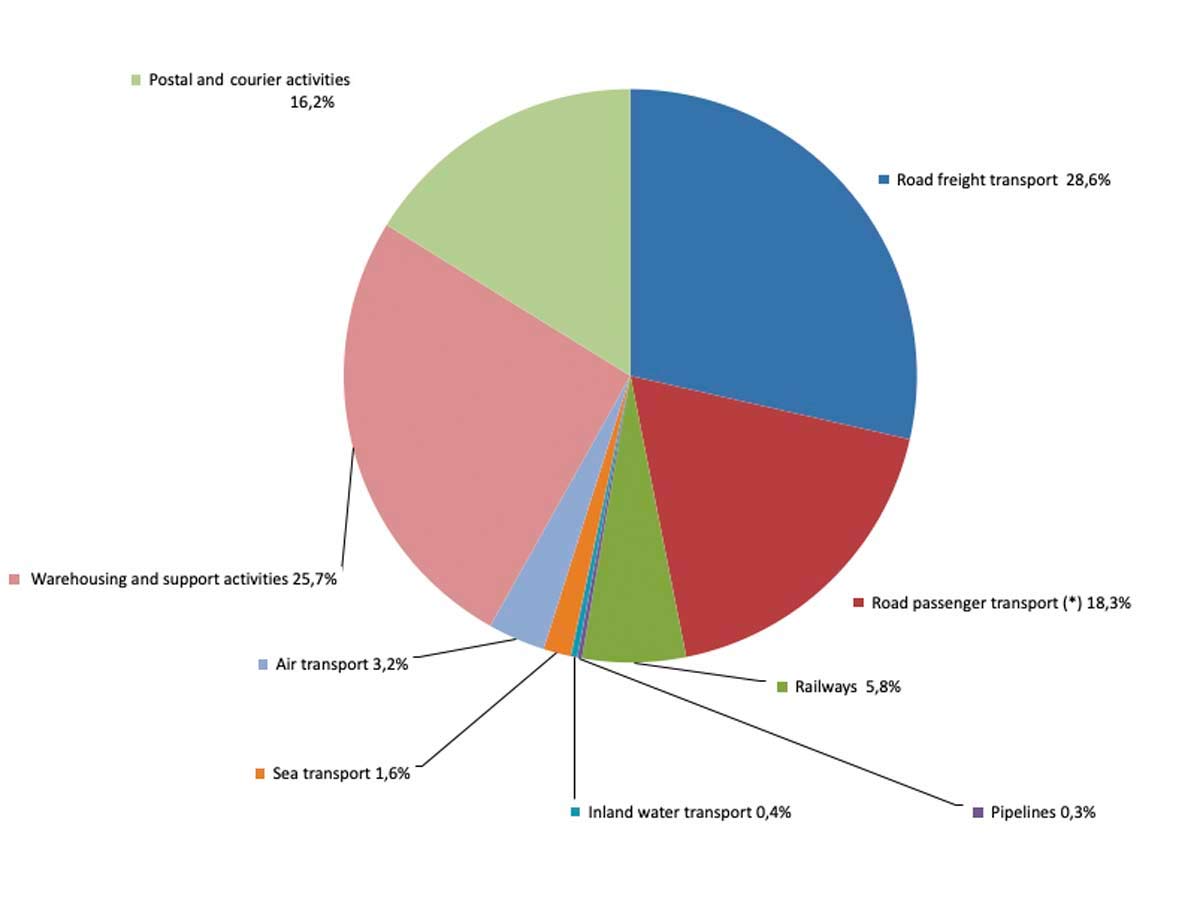
1.5 Employment by mode of transport in EU 28, 2016 (%)
Source: Eurostat
Notes: (*) Including all urban and suburban land transport modes (motor bus, tramway, streetcar, trolley bus, underground and elevated railways)
The above figures refer to employment only in those companies whose main activity lies in the mode concerned.


