2.1 Length of total road network by category(*) by country, end of 2017 (km)
| Motorways | Main or national roads | Secondary or regional roads | Other roads** | Total | |
| BE | 1 763 | 13 229 | 1 349 | 138 869 | 155 210 |
| BG | 734 | 2 928 | 4 028 | 12 171 | 19 861 |
| CZ | 1 223 | 5 825 | 48 692 | 74 919 | 130 659 |
| DK | 1 255 | 2 602 | 70 817 | 74 674 | |
| DE | 12 996 | 38 018 | 178 876 | 229 890 | |
| EE | 145 | 3 869 | 12 590 | 42 370 | 58 974 |
| IE | 916 | 4 390 | 13 120 | 80 472 | 98 898 |
| EL | 1 843 | 9 299 | 30 864 | 75 600 | 117 606 |
| ES | 15 444 | 14 905 | 135 259 | 501 053 | 666 661 |
| FR | 11 612 | 9 044 | 377 890 | 704 999 | 1 103 545 |
| HR | 1 310 | 6 969 | 9 521 | 9 022 | 26 822 |
| IT | 6 943 | 20 786 | 155 247 | 73 591 | 256 567 |
| CY | 272 | 2 219 | 2 313 | 5 066 | 9 870 |
| LV | – | 1 673 | 5 457 | 61 377 | 68 507 |
| LT | 324 | 6 352 | 14 566 | 50 482 | 71 724 |
| LU | 161 | 837 | 1 891 | 2 889 | |
| HU | 1 924 | 30 069 | 178 809 | 210 802 | |
| MT | – | 2 855 | 2 855 | ||
| NL | 2 758 | 2 627 | 7 782 | 126 523 | 139 690 |
| AT | 1 743 | 10 826 | 23 673 | 94 146 | 130 389 |
| PL | 1 640 | 1 425 | 153 757 | 249 136 | 405 958 |
| PT | 3 065 | 6 457 | 4 791 | 14 313 | |
| RO | 747 | 16 891 | 35 149 | 33 296 | 86 083 |
| SI | 773 | 5 917 | 13 361 | 18 883 | 38 934 |
| SK | 463 | 3 593 | 13 967 | 38 895 | 56 918 |
| FI | 890 | 12 575 | 13 451 | 51 065 | 77 981 |
| SE | 2 118 | 13 565 | 157 208 | 42 488 | 215 379 |
| UK | 3 764 | 49 215 | 33 197 | 336 337 | 422 514 |
| AL | 0 | ||||
| ME | – | 7 928 | 7 928 | ||
| MK | 259 | 640 | 3 778 | 9 733 | 14 410 |
| RS | 610 | 3 532 | 10 743 | 29 346 | 44 231 |
| TR | 2 542 | 31 066 | 33 896 | 179 895 | 247 399 |
| IS | 11 | 4 919 | 2 950 | 5 010 | 12 890 |
| NO | 392 | 10 683 | 44 622 | 39 457 | 95 154 |
| CH | 1 447 | 397 | 17 843 | 51 859 | 71 546 |
Source : Eurostat, International Road Federation, national statistics, estimates
(*) The definition of road types varies from country to country, the data are therefore not comparable.
(**) “Other roads” sometimes includes roads without a hard surface.
(***) BE end of 2009 EL end of 2010 IT end of 2015 UK 1st of April 2016 IS end of 2011.
2.2 Length of total road network by country, 2017 (km)
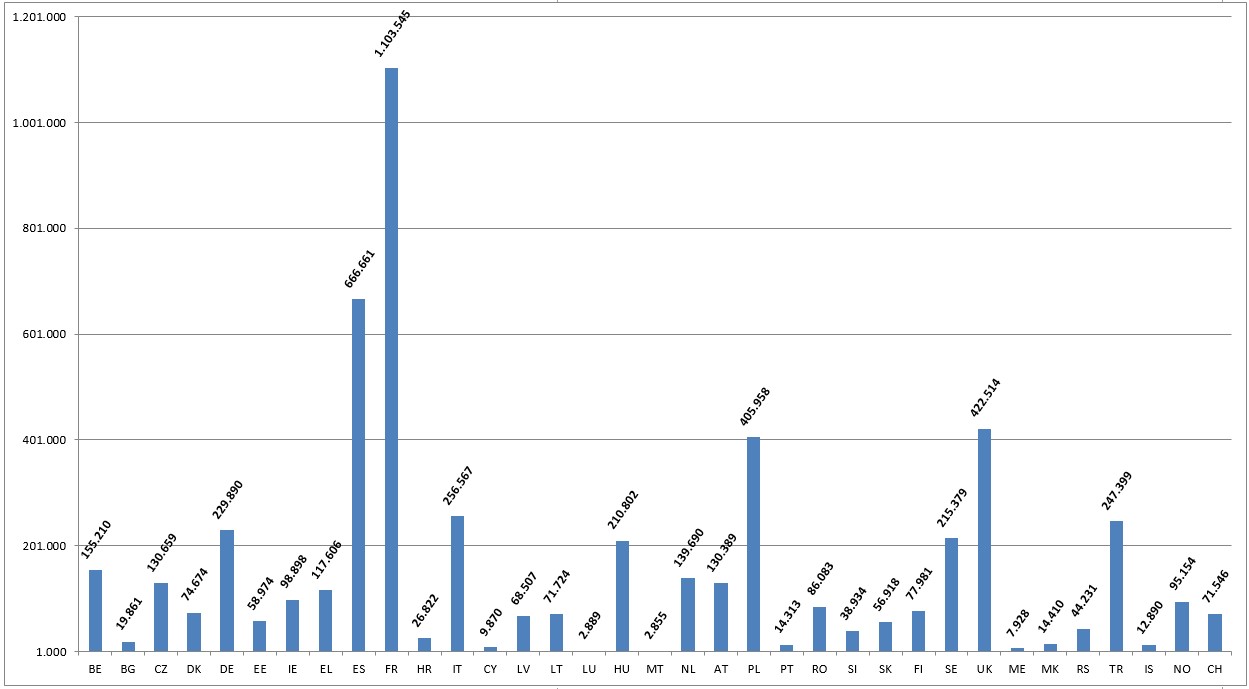
Source: EC, IRF
Notes:
“Other roads” sometimes includes roads without a hard surface.
BE end of 2009
EL end of 2010
IT end of 2015
UK 1st April 2016
IS end of 2011
2.3 Density of the total road network in EU countries, 2017 (km road/ km² land area)
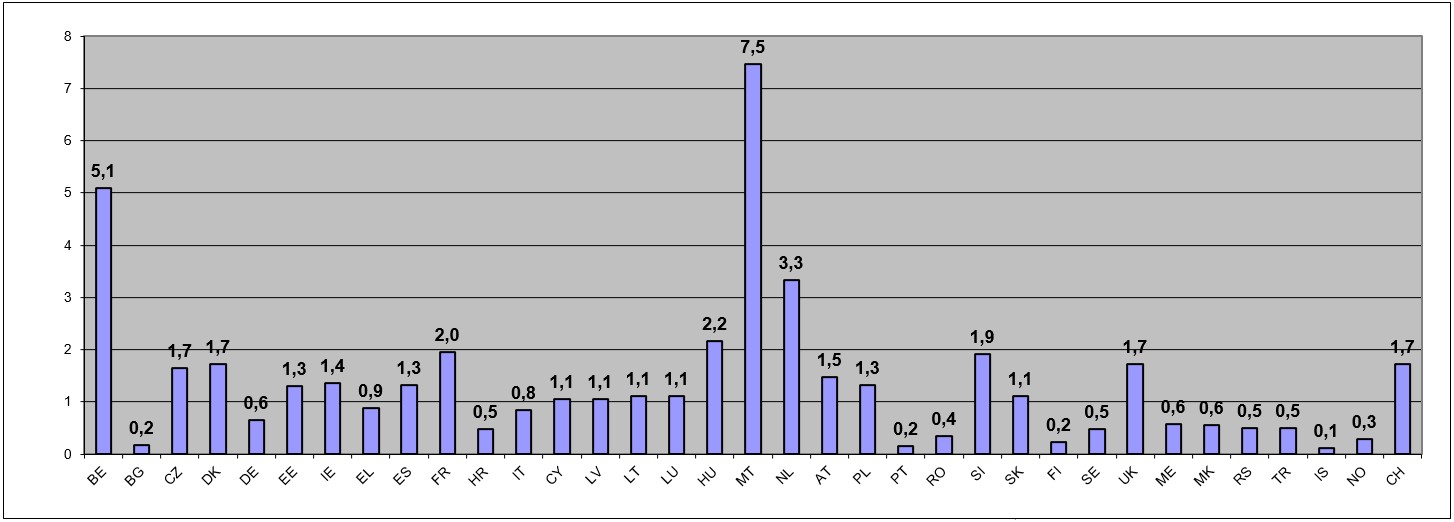
Source: EC
Notes:
(1) : The definition of road types varies from country to country, the data are therefore not comparable.
(2): “Other roads” sometimes includes roads without a hard surface.
BE end of 2009
EL end of 2010
UK 1st Apri,2014
IS end of 2011
2.4 Length of motorway network in EU countries, 2017 (km)
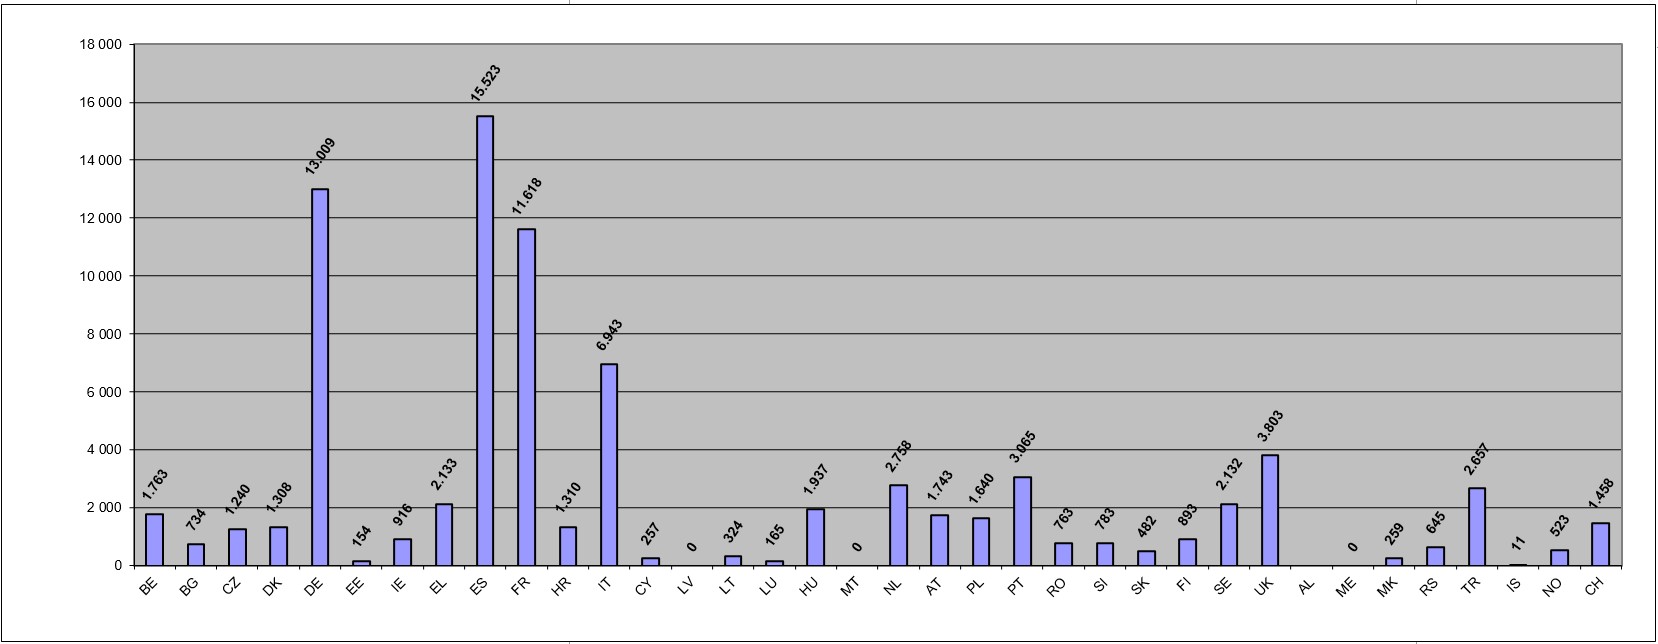
Source: Eurostat, International Road Federation, United Nations Economic Commission for Europe, ASECAP statistical bulletin, national statistics, estimates (in italics)
Notes:
CZ: As from 2016 most of expressways have been changed into class II motorways.
ES: ‘autopistas de peaje’ and ‘autovías y autopistas libres’
CY: from 2006: without urban M-ways
NL: all national roads (‘Rijkswegen’) with dual carriageways
UK: data refers to the 1st of April.
2.5 Proportion of motorways compared to the total road network in EU countries, 2017 (%)
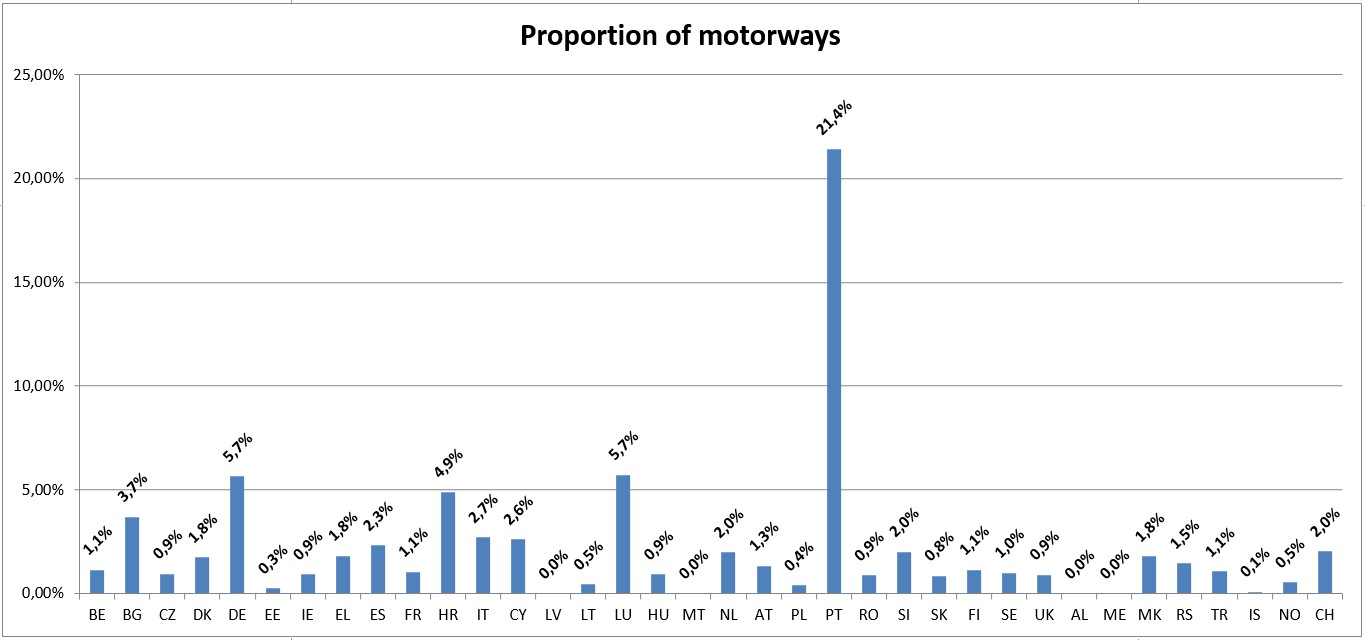
Source: EC
Notes:
(1) : “Other roads” sometimes includes roads without a hard surface.
BE end of 2009
EL end of 2010
UK 1st Apri,2014
IS end of 2011
MT end of 2012
2.6 Density of motorways in EU countries, 2017 (km motorway per 100 km² land area)
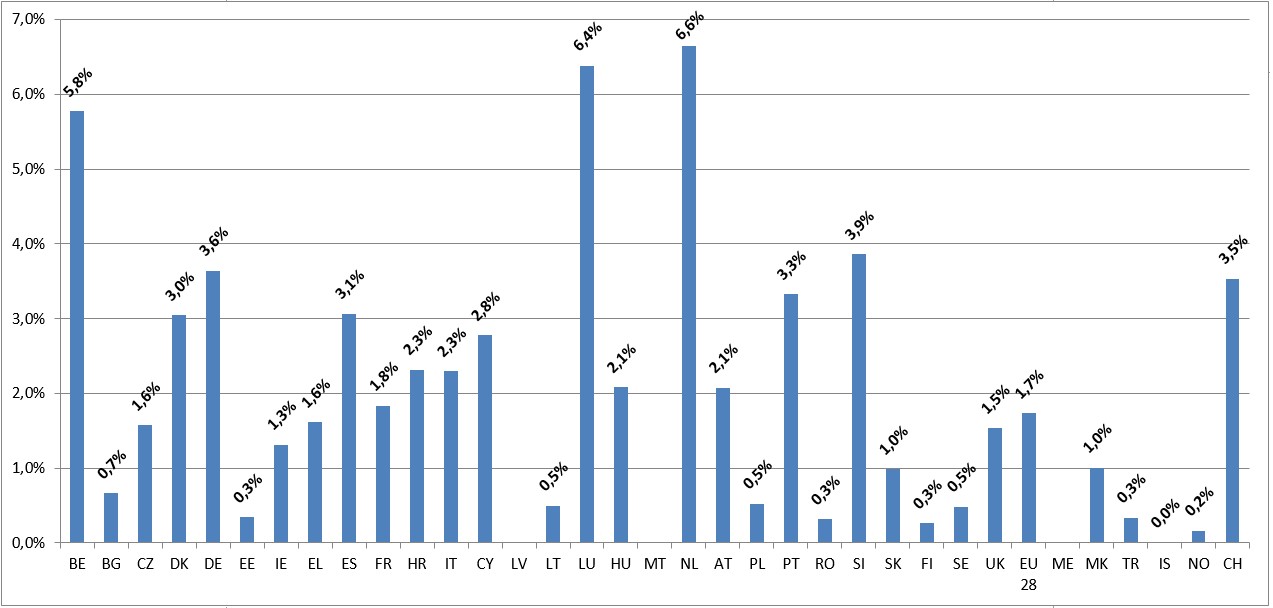
Source: Eurostat, EC
Notes:
EL end of 2010
UK 1st Apri,2014
IS end of 2011
MT end of 2012
2.7 Passenger cars per km of motorway in EU countries, 2017

Source: Eurostat, EC, UNECE statistical database
Notes:
Stock at end of year, except for BE: 1 August (1 July in 2012), CH: 30 September
Taxis are usually included.
2.8 Transport network Comparison between EU 28, USA, Japan, Russia and China, 2017 (thousand km)
| EU 28 | USA (1) | Japan (2) | China | Russia | |
| Road network (paved) |
4.817 | 4.474 | 1.003 | 4.339 | 1.171 |
| Motorway network | 77,4 | 95,3 | 9,0 | 136,4 | 52,0 |
| Railway network | 217,2 | 202,7 | 19,3 | 127,0 | 87,0 |
| Electrified rail lines | 117,3 | 11,7 | 43,7 | 44,0 |
Source: Eurostat, International Road Federation, International Transport Forum, Union Internationale des Chemins de Fer, national statistics, estimates (in italics)
Notes:
(1): Divided highways with 4 or more lanes (rural or urban interstate, freeways, expressways, arterial and collector) with full access control by the authorities.
(2): Japan: national expressways.
(3): Russia: federal roads, 2016 figures
(4): USA: a sum of partly overlapping networks.
(5): China: both oil and gas pipelines
(6): Russia: only crude oil pipelines. 17 thousand km of oil products pipelines are not included.
(7): USA: light duty vehicles, short wheel and long wheel base.
(8): Japan: ordinary, small and light four-wheeled vehicles.
(9): Japan: including 8.7 million light motor vehicles.
2.9 Density of motorways Comparison between EU 28, USA, Japan, Russia and China, 2017 (km motorway per km² land area)
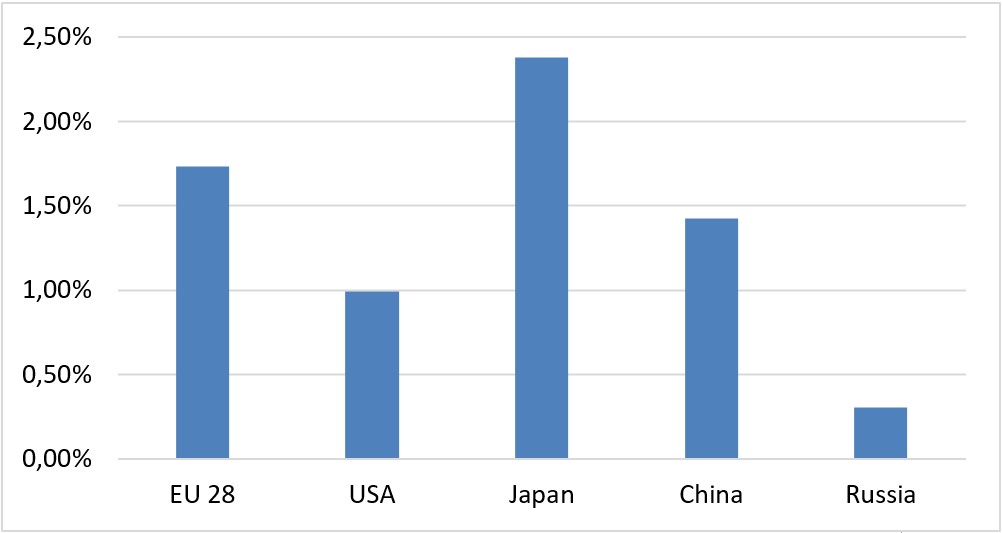
Source: EC, IRF
Notes:
Area EU 28: including French overseas department
2.10 Passenger cars per km of motorway. Comparison between EU 28, USA, Japan, Russia and China, 2017
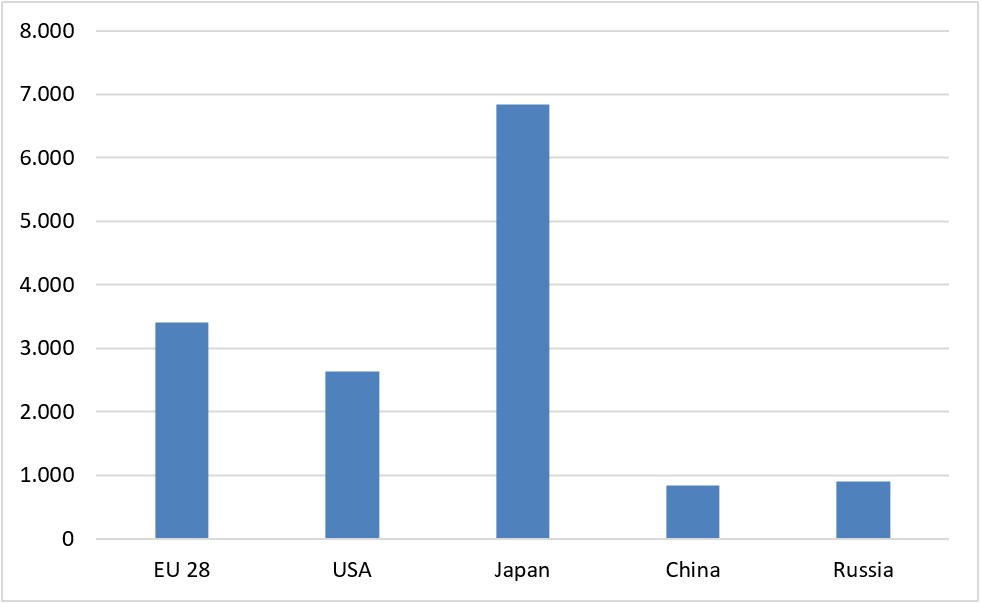
Source: Eurostat, International Road Federation, International Transport Forum, Union Internationale des Chemins de Fer, national statistics, estimates (in italics)
2.11 Cars/1000 person in EU 28, USA, Japan, Russia and China, 2017
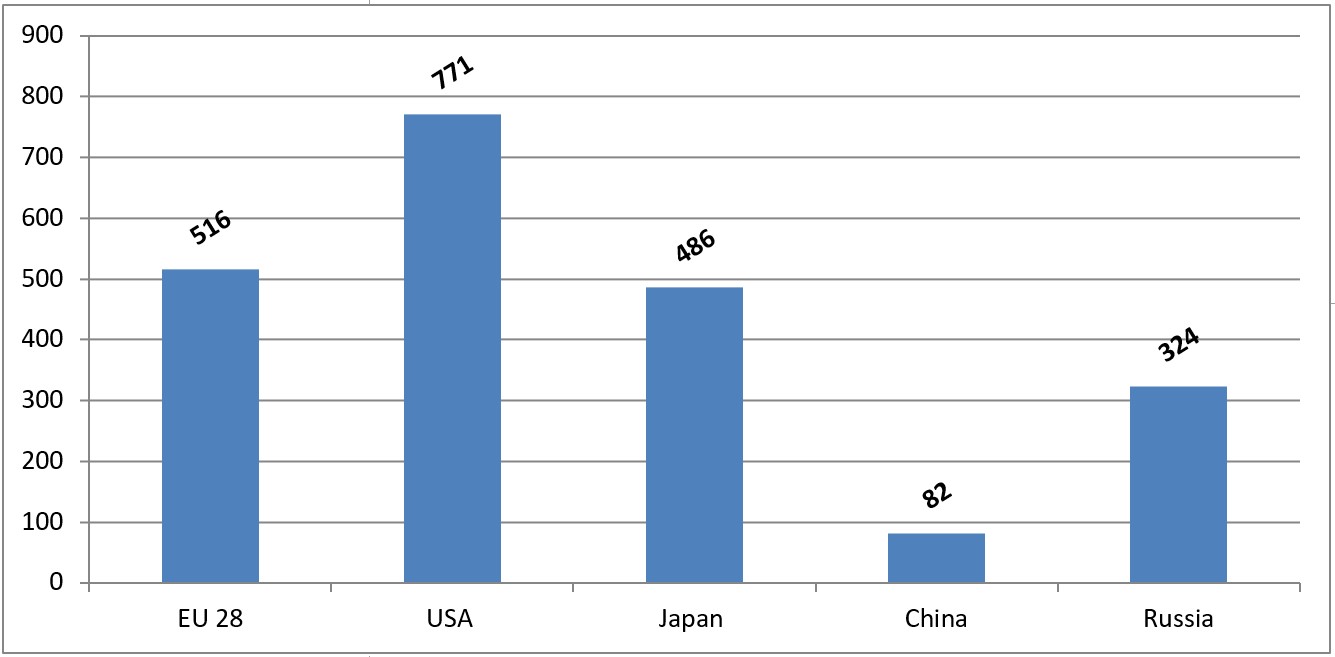
Source: EC
