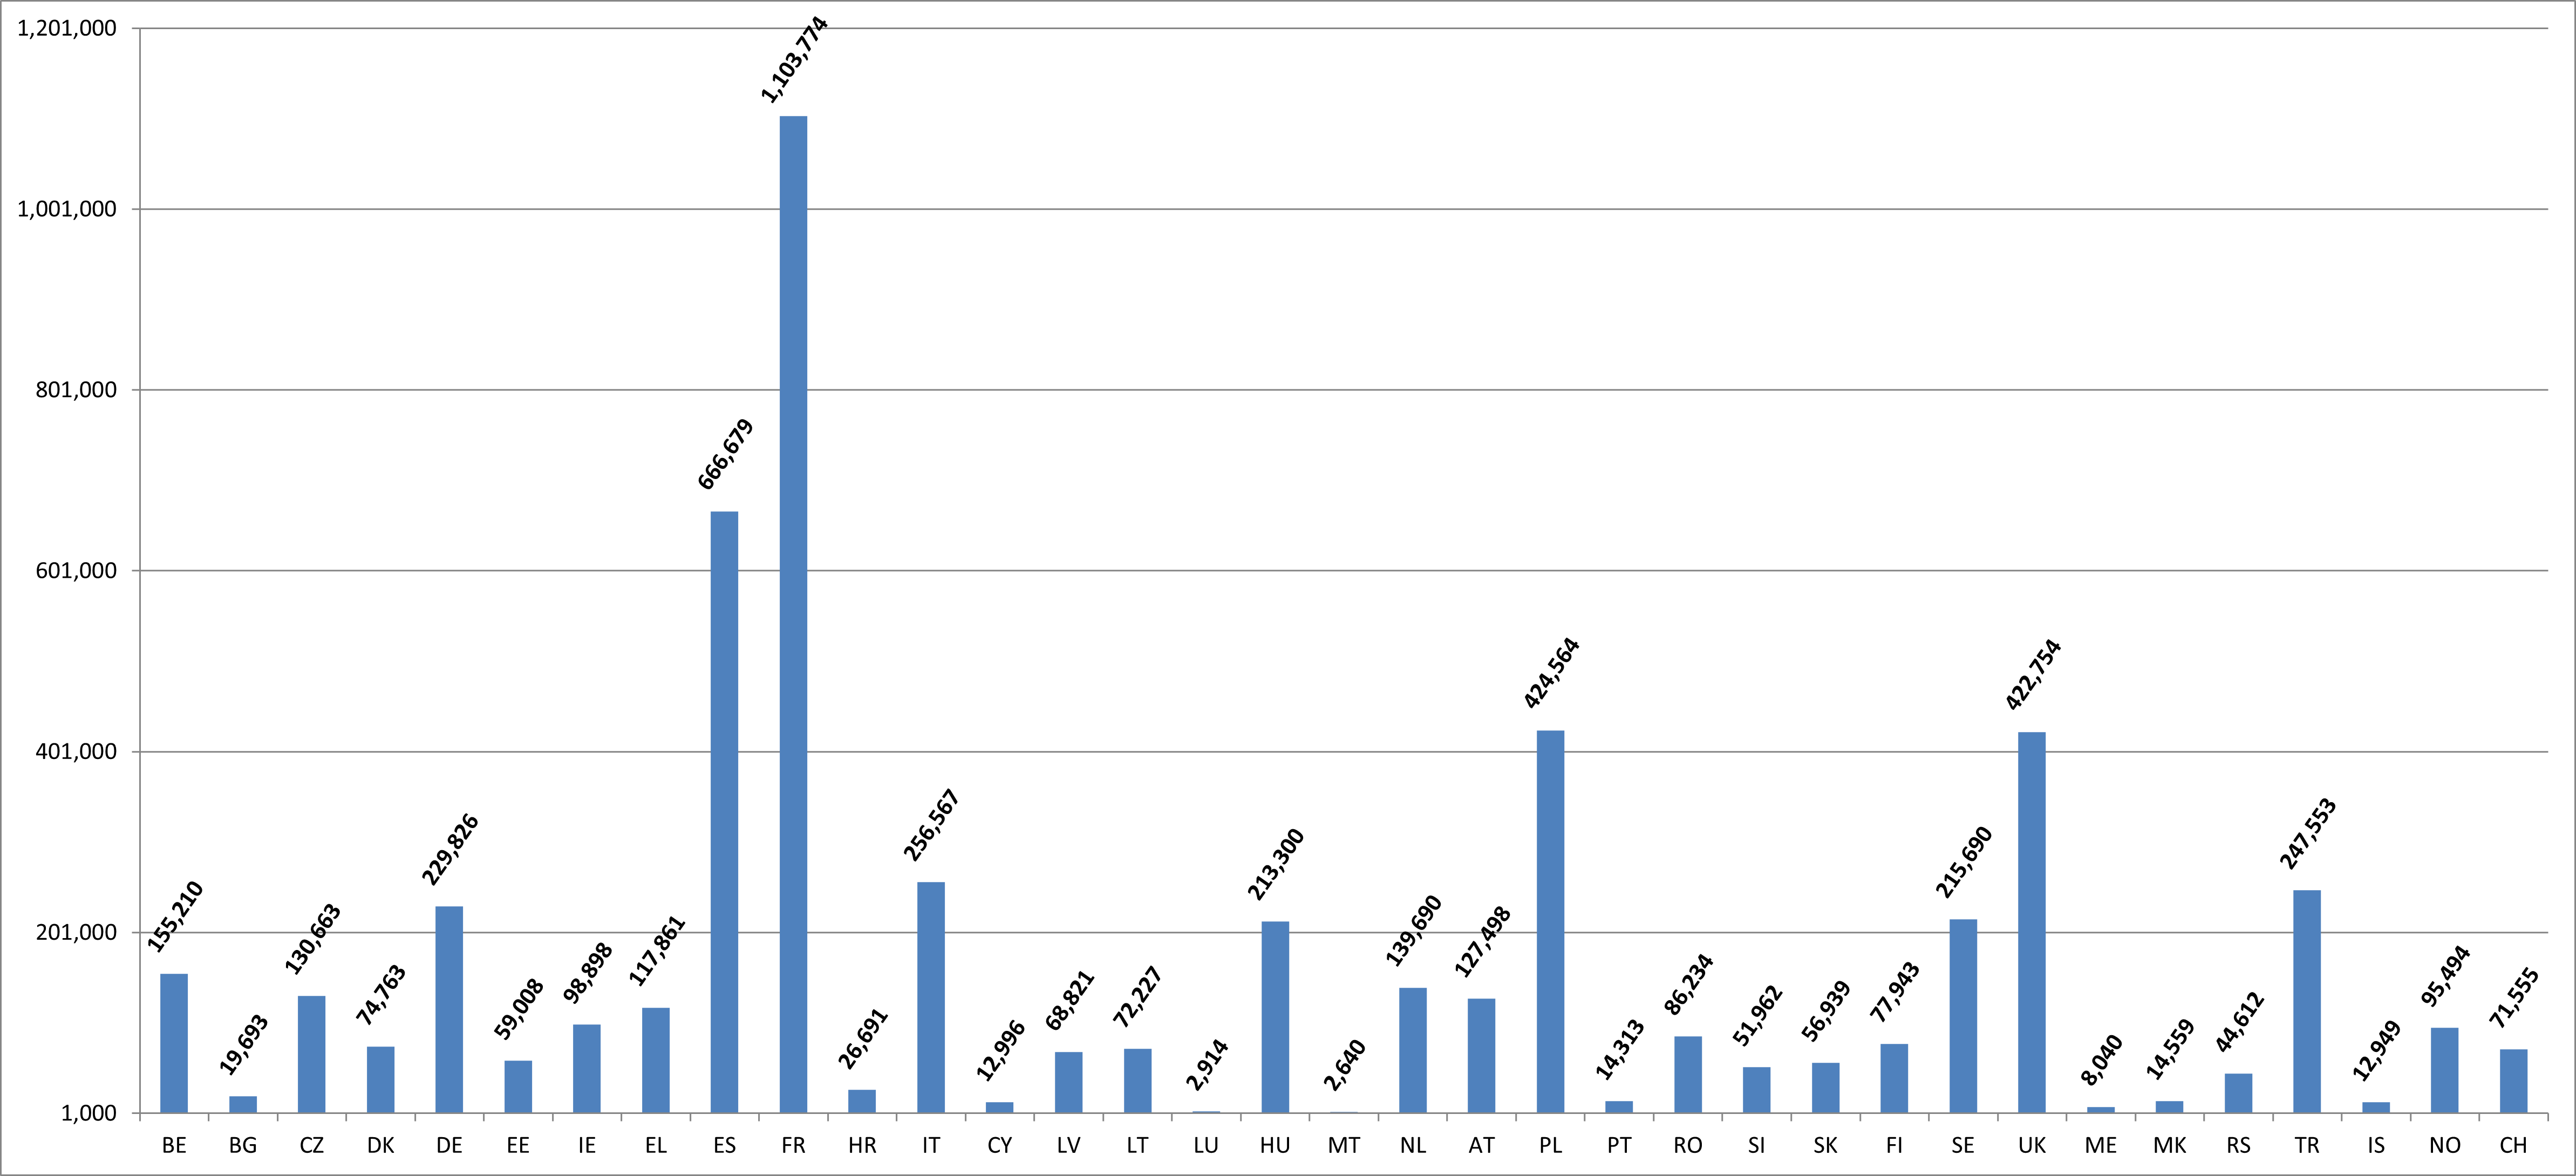
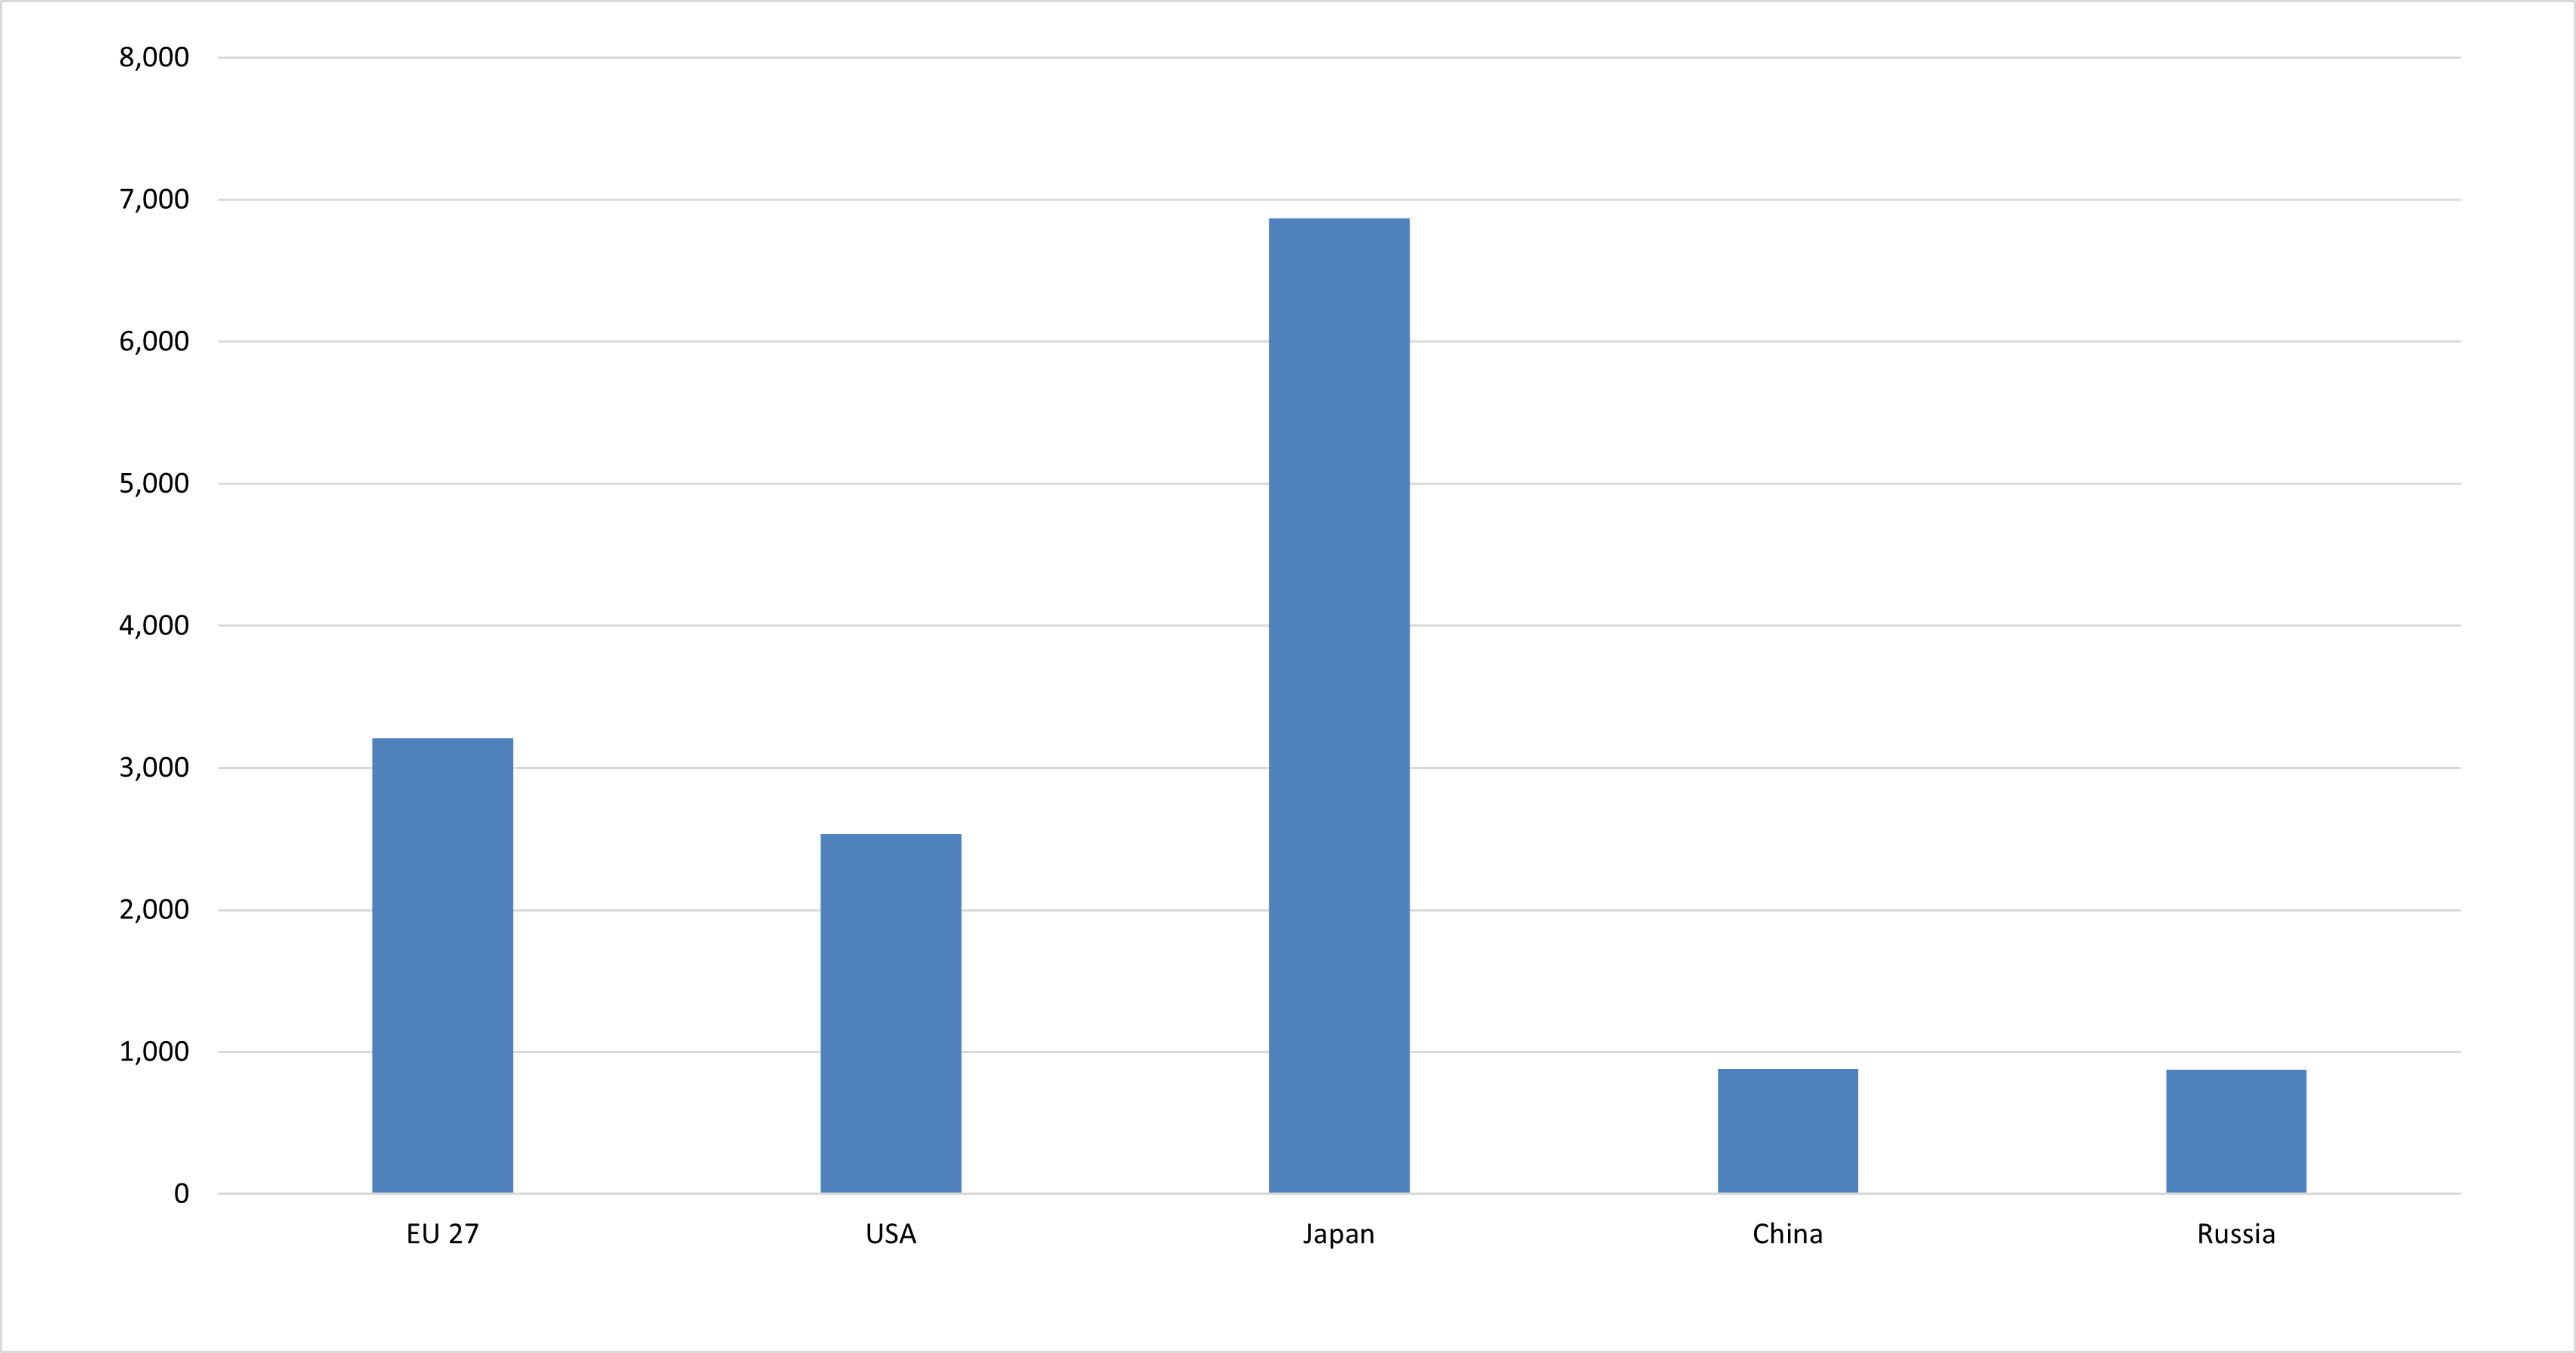
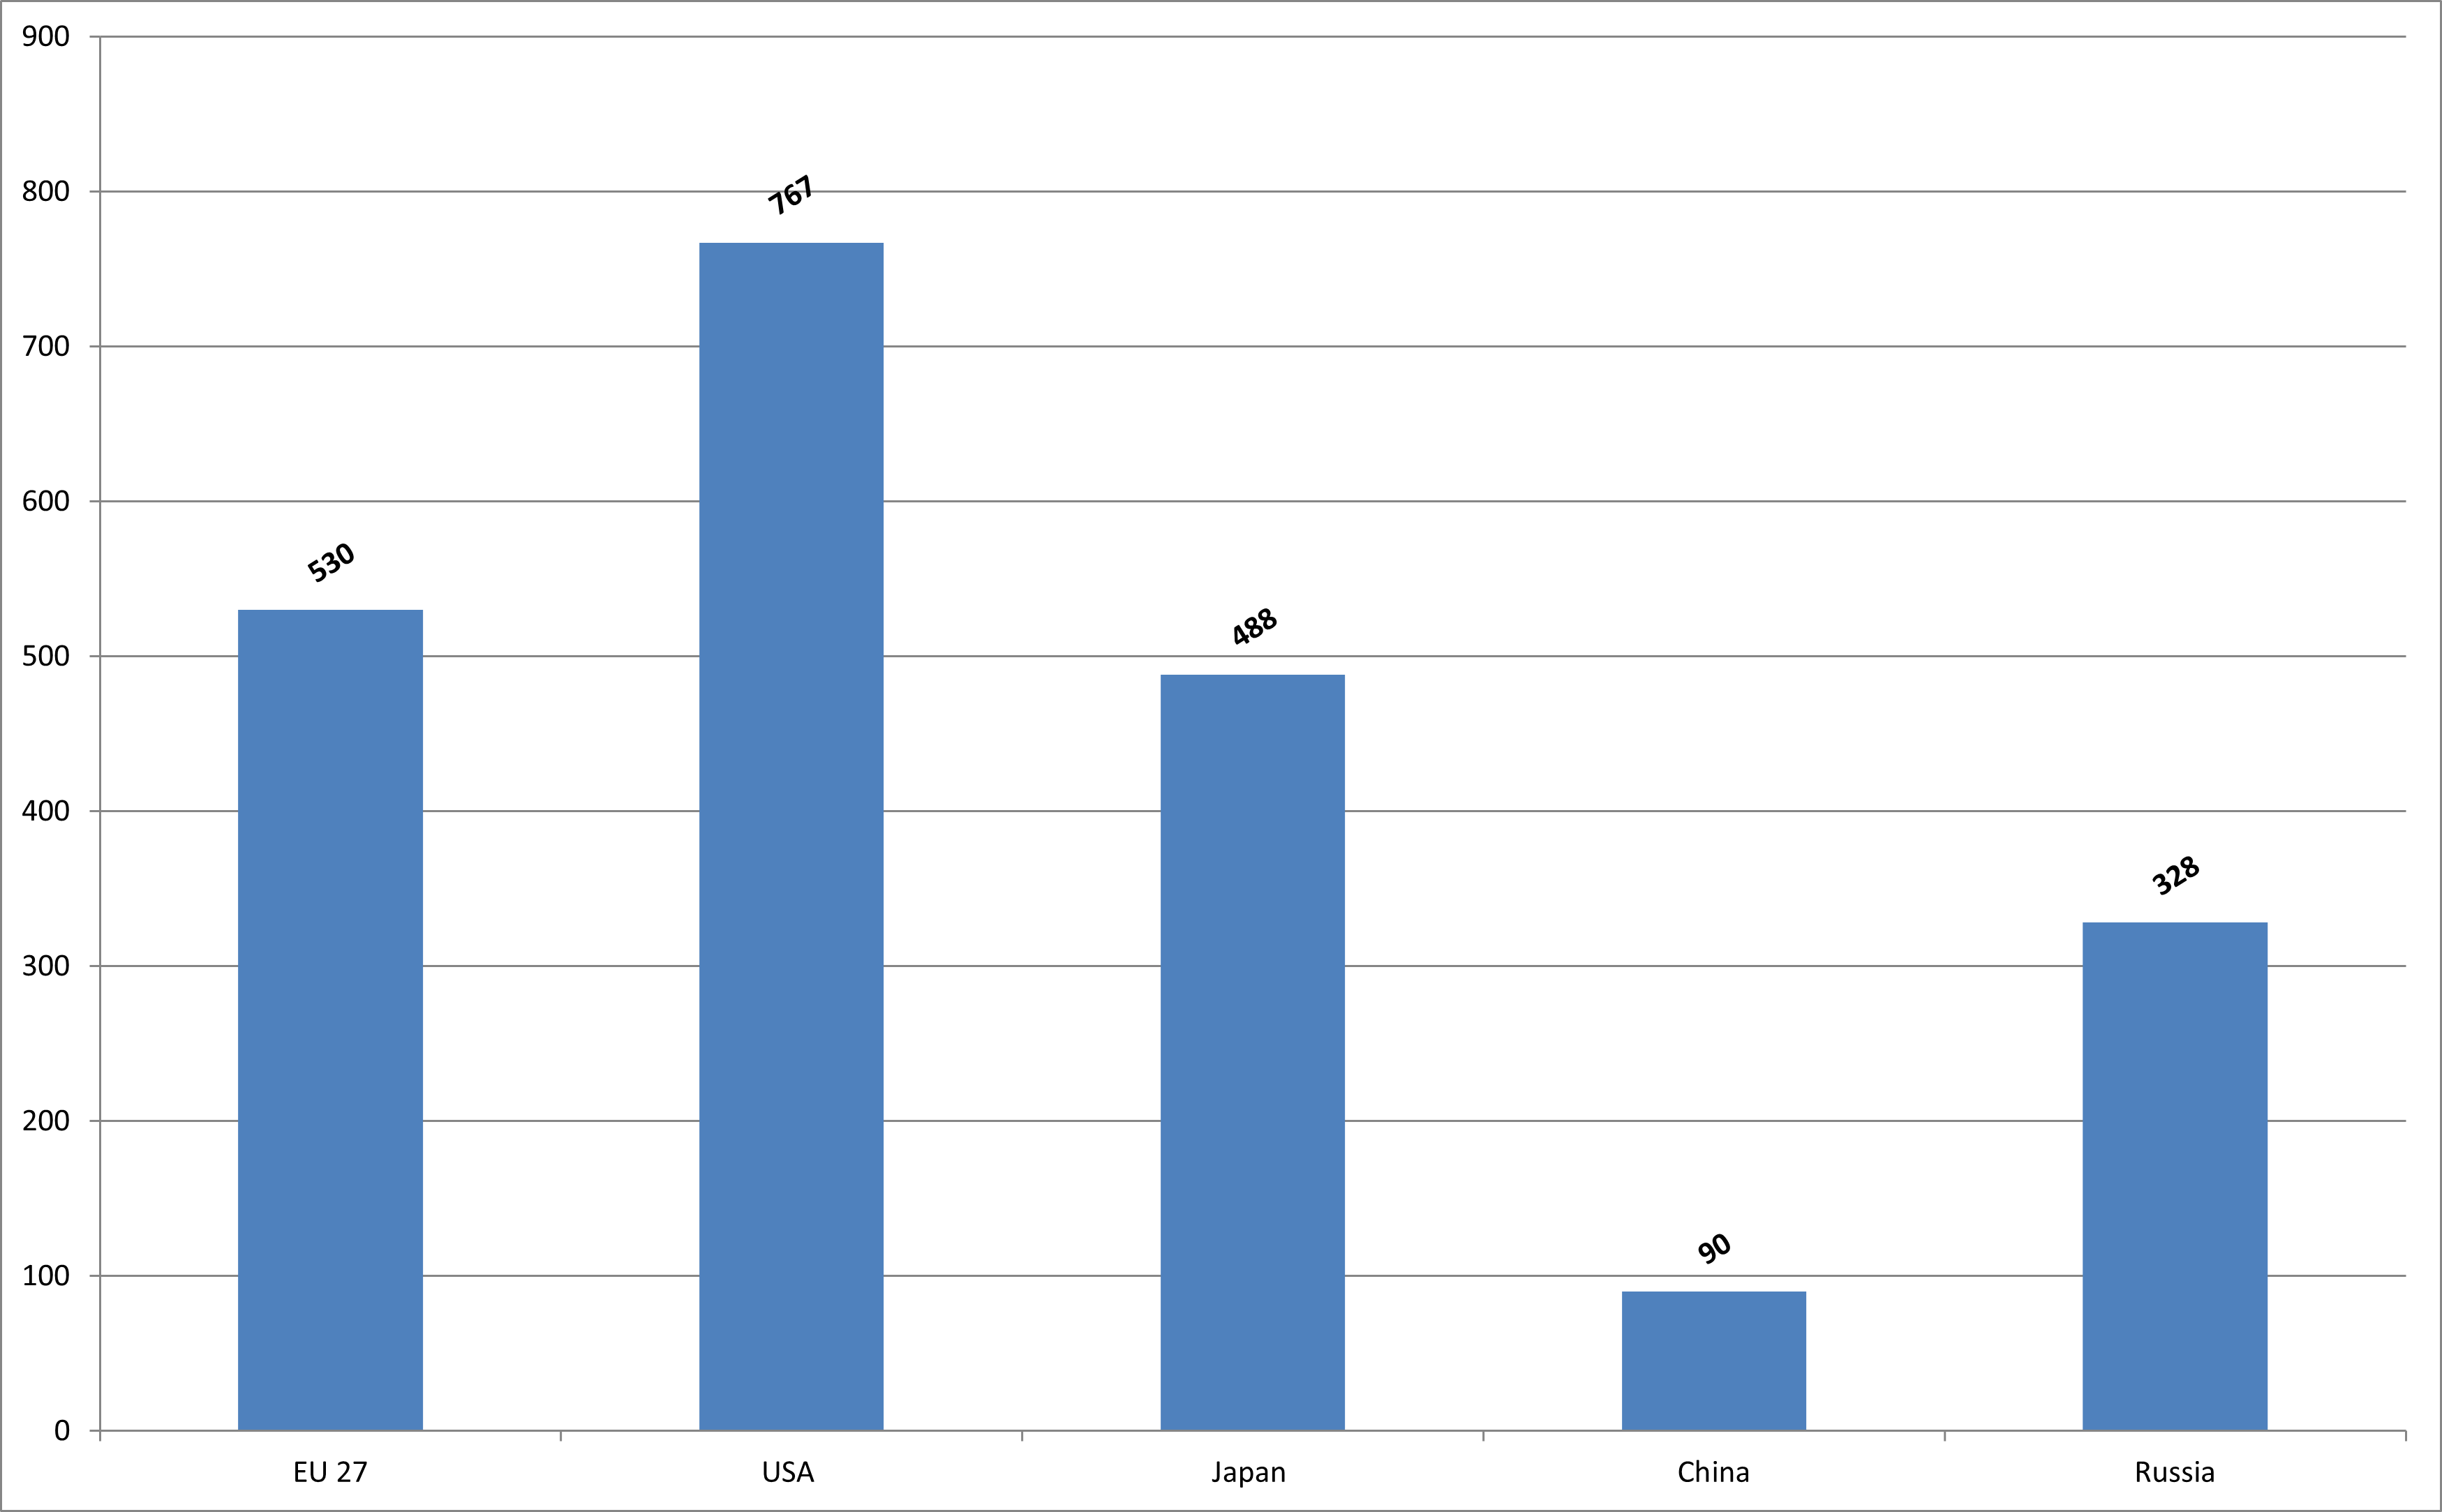
2.1 Length of total road network by category(*) by country, end of 2018 (km)
| Motorways | Main or national roads | Secondary or regional roads | Other roads** | Total | |
| BE | 1 763 | 13 229 | 1 349 | 138 869 | 155 210 |
| BG | 757 | 2 925 | 4 022 | 11 989 | 19 693 |
| CZ | 1 252 | 5 818 | 48 674 | 74 919 | 130 663 |
| DK | 1 329 | 2 594 | 70 840 | — | 74 763 |
| DE | 13 141 | 37 879 | 178 806 | — | 229 826 |
| EE | 154 | 3 861 | 12 595 | 42 398 | 59 008 |
| IE | 916 | 4 390 | 13 120 | 80 472 | 98 898 |
| EL | 2 098 | 9 299 | 30 864 | 75 600 | 117 861 |
| ES | 15 585 | 14 870 | 135 171 | 501 053 | 666 679 |
| FR | 11 671 | 9 551 | 378 401 | 704 151 | 1 103 774 |
| HR | 1 310 | 7 019 | 9 545 | 8 817 | 26 691 |
| IT | 6 943 | 20 786 | 155 247 | 73 591 | 256 567 |
| CY | 257 | 5 446 | 2 358 | 4 935 | 12 996 |
| LV | – | 1 673 | 5 453 | 61 695 | 68 821 |
| LT | 324 | 6 676 | 14 559 | 50 668 | 72 227 |
| LU | 165 | 839 | 1 891 | 19 | 2 914 |
| HU | 1 982 | 30 088 | — | 181 230 | 213 300 |
| MT | — | 520 | — | 2 120 | 2 640 |
| NL | 2 756 | 2 629 | 7 782 | 126 523 | 139 690 |
| AT | 1 749 | 10 858 | 23 653 | 91 238 | 127 498 |
| PL | 1 637 | 17 766 | 153 497 | 251 664 | 424 564 |
| PT | 3 065 | 6 457 | 4 791 | — | 14 313 |
| RO | 823 | 16 917 | 35 085 | 33 409 | 86 234 |
| SI | 623 | 5 917 | 13 361 | 32 061 | 51 962 |
| SK | 482 | 3 594 | 13 969 | 38 895 | 56 939 |
| FI | 926 | 12 541 | 13 470 | 51 006 | 77 943 |
| SE | 2 132 | 13 557 | 157 221 | 42 780 | 215 690 |
| UK | 3 857 | 49 699 | 33 216 | 335 983 | 422 754 |
| ME | — | 8 040 | — | — | 8 040 |
| MK | 287 | 615 | 3 779 | 9 878 | 14 559 |
| RS | 645 | 3 890 | 10 040 | 30 037 | 44 612 |
| TR | 2 842 | 31 021 | 34 153 | 179 537 | 247 553 |
| IS | 41 | 4 370 | 3 380 | 5 158 | 12 949 |
| NO | 599 | 10 713 | 44 639 | 39 543 | 95 494 |
| CH | 1 462 | 397 | 17 816 | 51 880 | 71 555 |
Source: Eurostat [road_if_roadsc], International Road Federation (www.irfnet.ch) (BE, EL, LU, MT, IS), national statistics
Notes:
*: the definition of road types varies from country to country, the data are therefore not fully comparable. MT, CY: data for 2016
“Other roads” sometimes includes roads without a hard surface.
*BE end of 2015 IT end of 2015 UK 1st of April 2019 MT end of 2017 CY:”other roads” sometimes includes roads without a hard surface
2.2 Length of total road network by country, 2018 (km)
Source: EC, IRF
Notes: “Other roads” sometimes includes roads without a hard surface.
BE end of 2015
IT end of 2015
UK 1st of April 2019
MT end of 2017
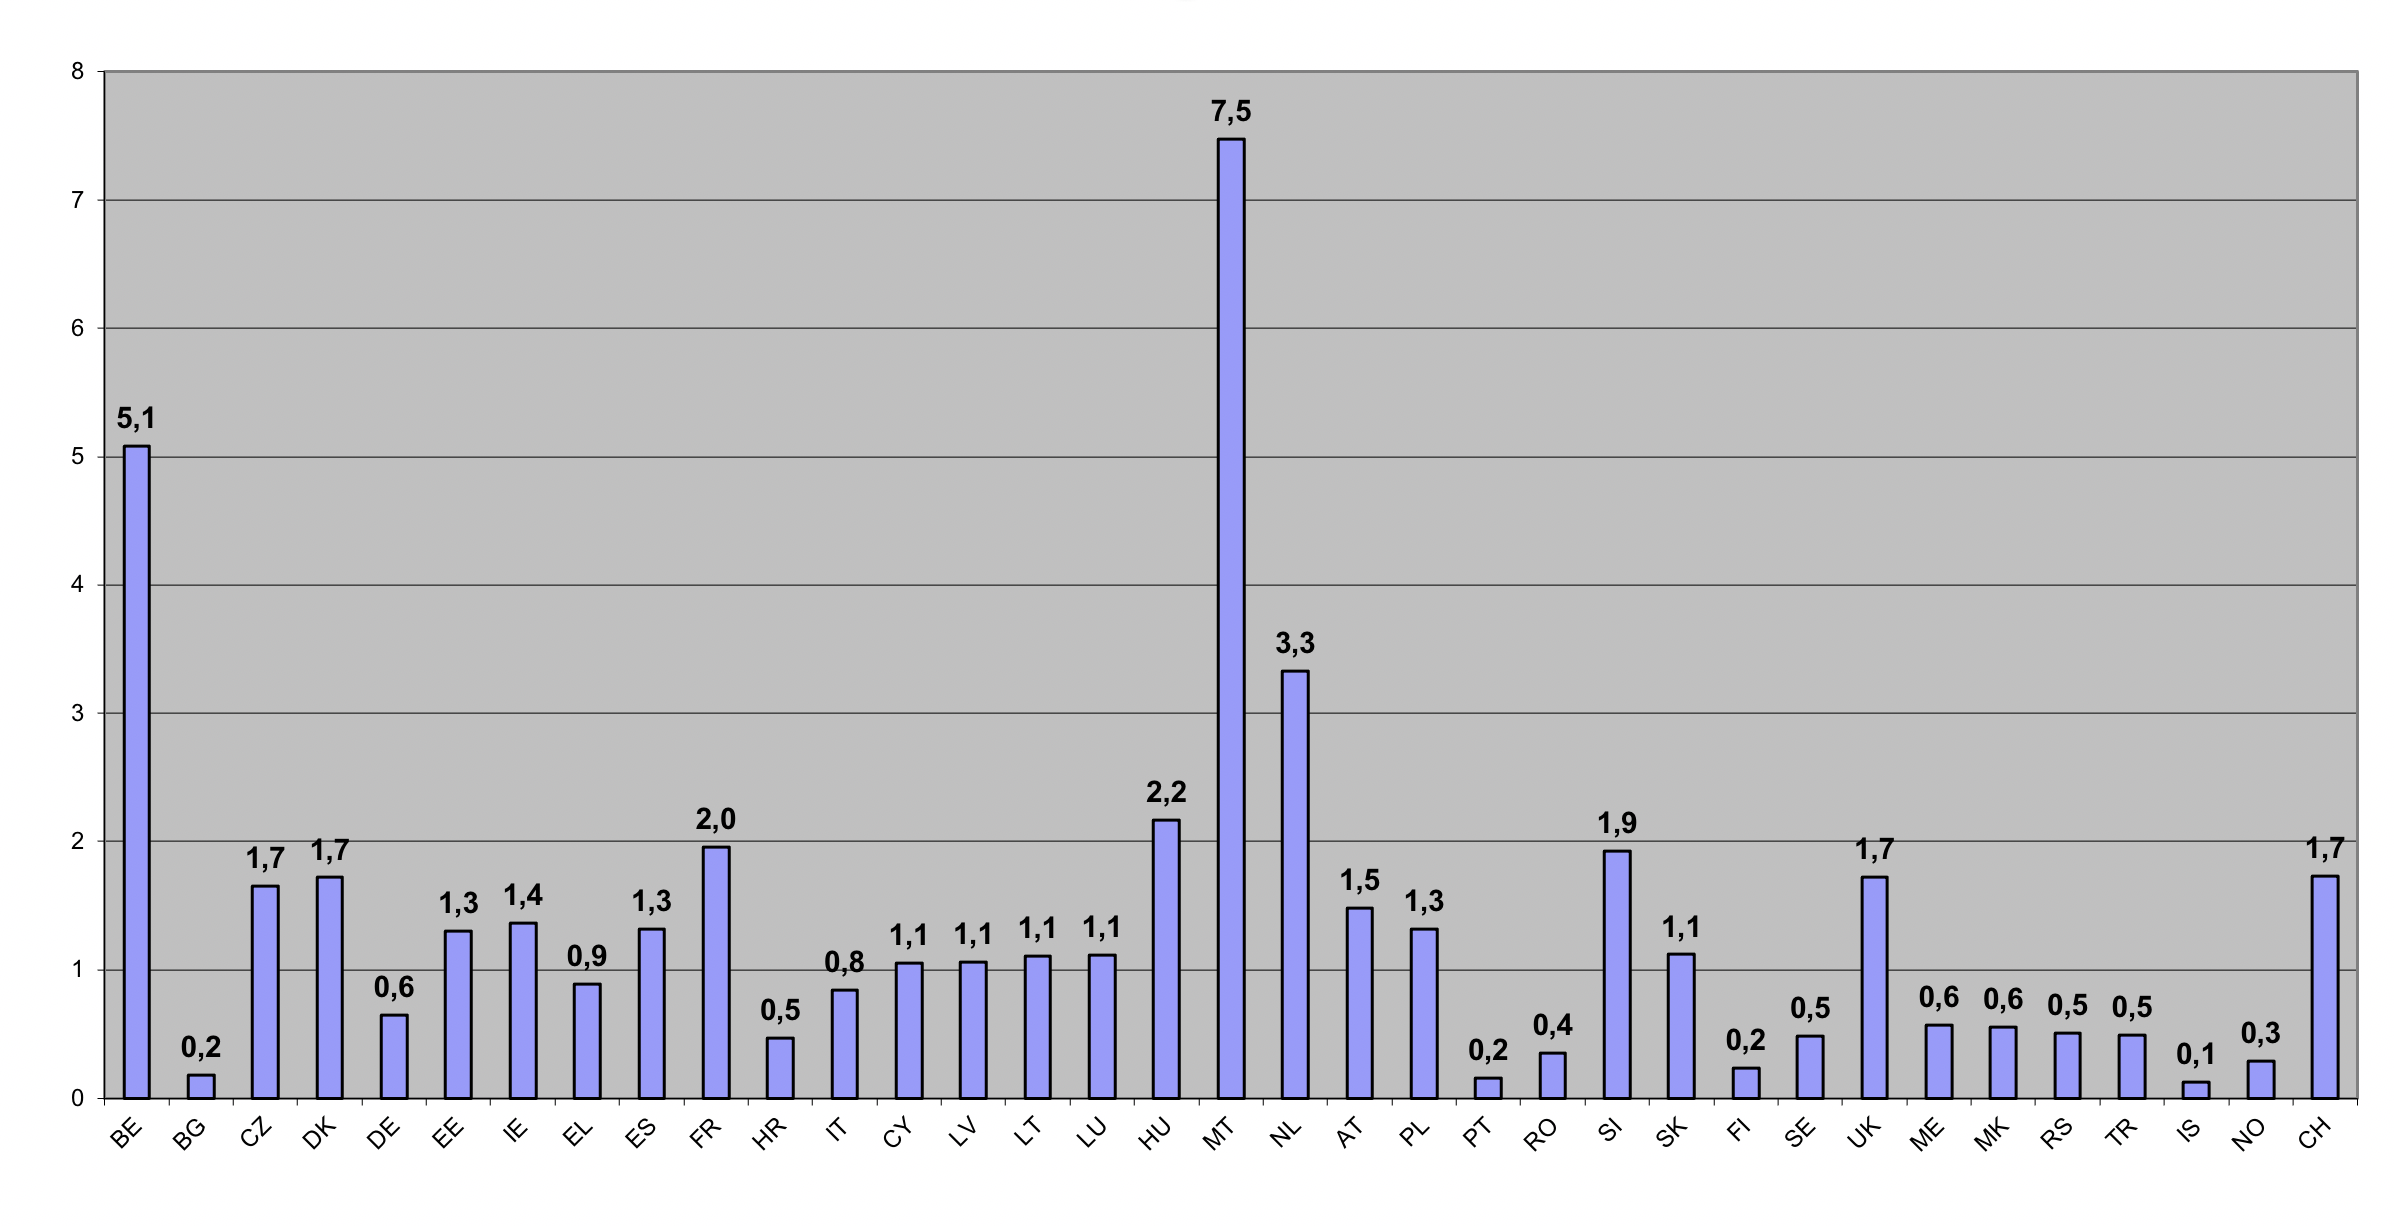
2.3 Density of the total road network in EU countries, 2018 (km road/ km² land area)
Source: EC
Notes: *: the definition of road types varies from country to country, the data are therefore not comparable.
“Other roads” sometimes includes roads without a hard surface.
BE end of 2015
IT end of 2015
UK 1st of April 2019
MT end of 2017
2.4 Length of motorway network in EU countries, 2018 (km)
Source: Eurostat, International Road Federation, United Nations Economic Commission for Europe, ASECAP statistical bulletin, national statistics, estimates (in italics)
Notes:
IT: 2017 figure
BE: situation at the end of 2015
CZ: as from 2016 most of expressways have been changed into class II motorways.
ES: ‘autopistas de peaje’ and ‘autovías y autopistas libres’
CY: from 2006: without urban M-ways
NL: all national roads (‘Rijkswegen’) with dual carriageways
UK: data refers to the 1st of April.
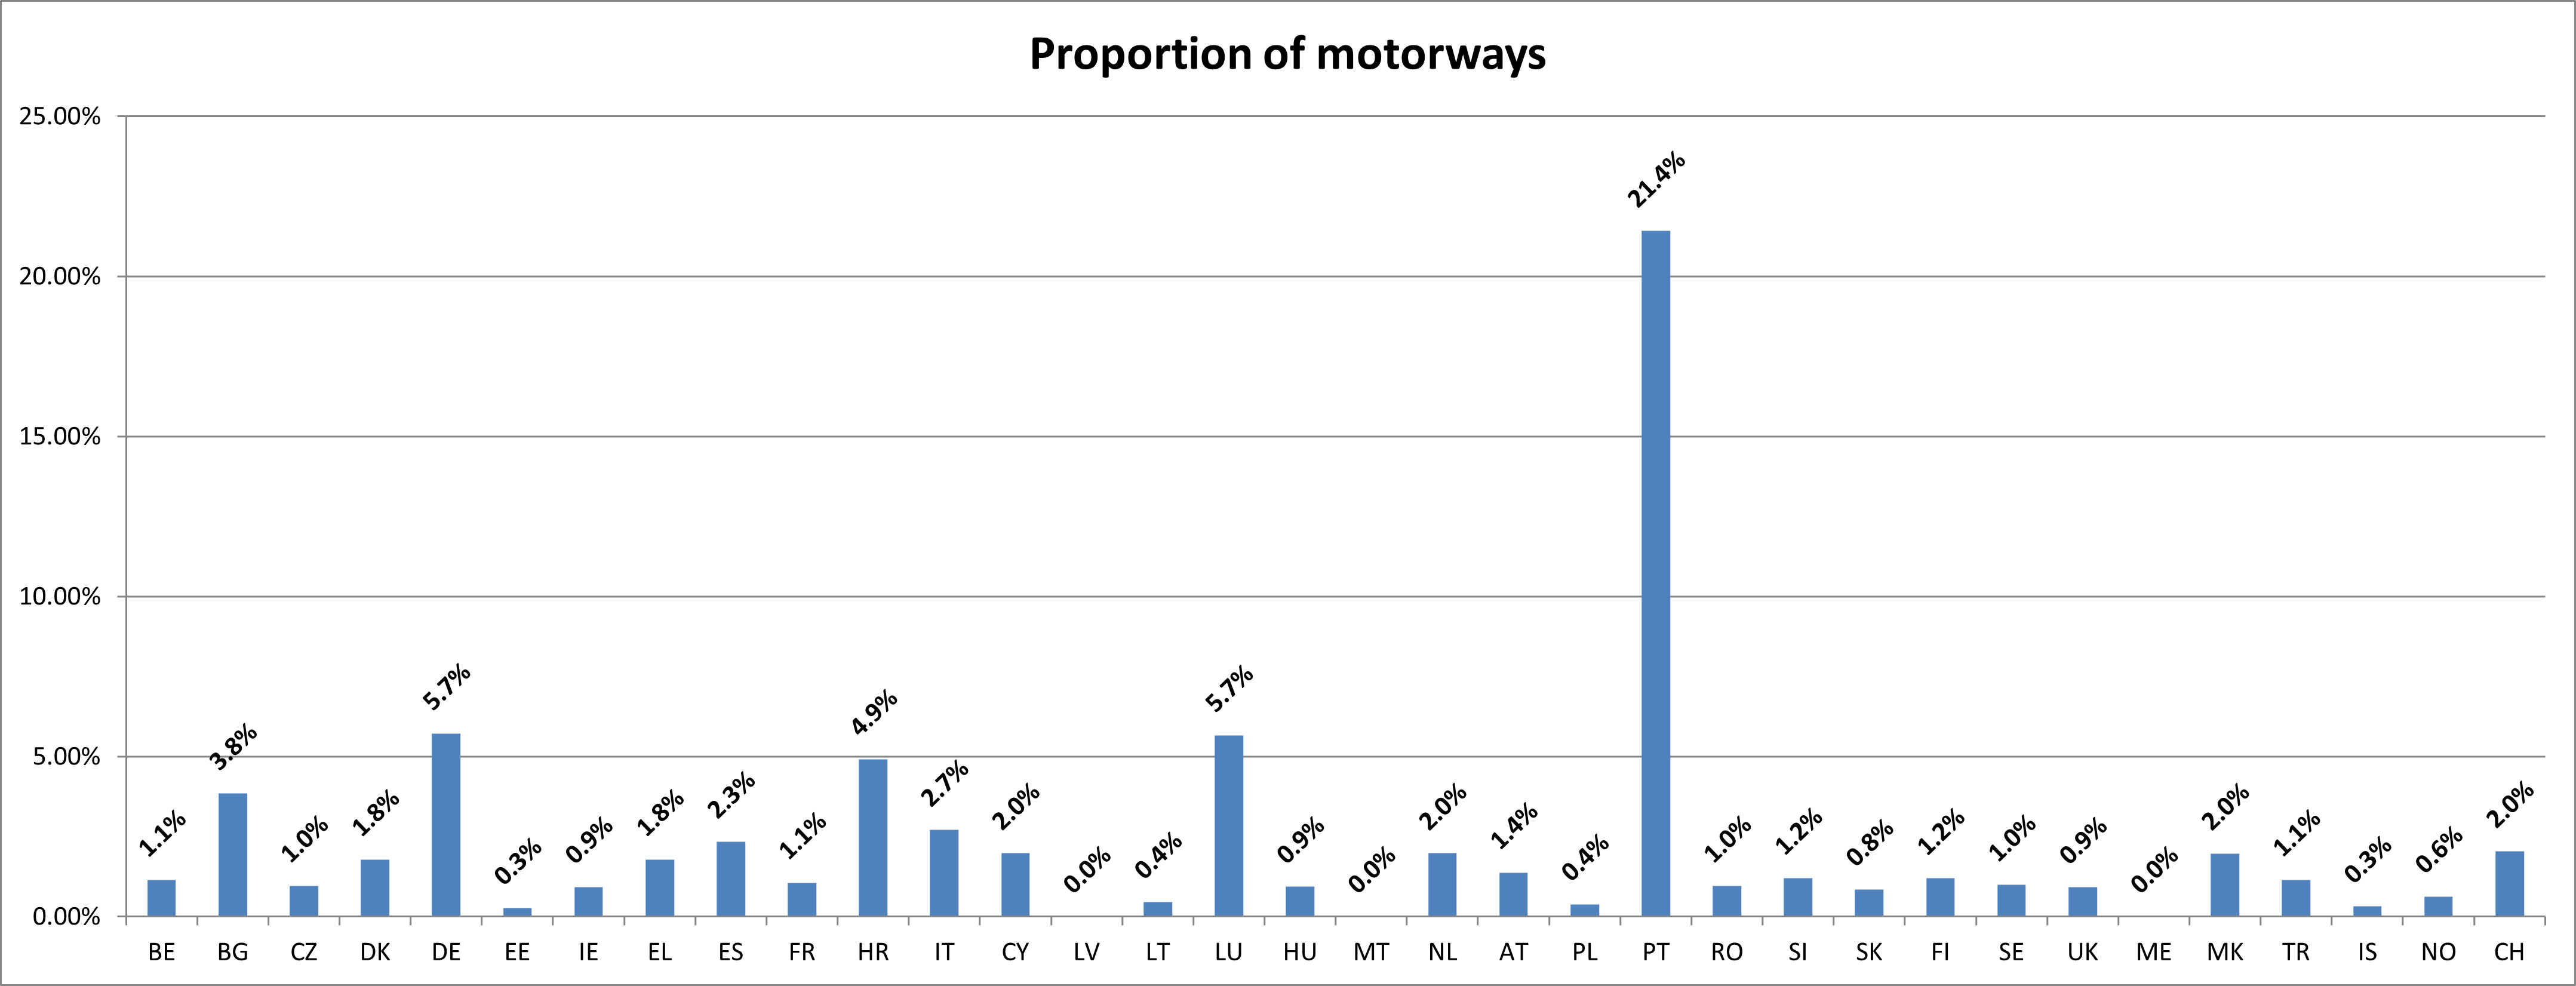
2.5 Proportion of motorways compared to the total road network in EU countries, 2018 (%)
Source: Eurostat, International Road Federation, United Nations Economic Commission for Europe, ASECAP statistical bulletin, national statistics, estimates (in italics)
Notes:
IT: 2017 figure
BE: situation at the end of 2015
CZ: as from 2016 most of expressways have been changed into class II motorways.
ES: ‘autopistas de peaje’ and ‘autovías y autopistas libres’
CY: from 2006: without urban M-ways
NL: all national roads (‘Rijkswegen’) with dual carriageways
UK: data refers to the 1st of April.
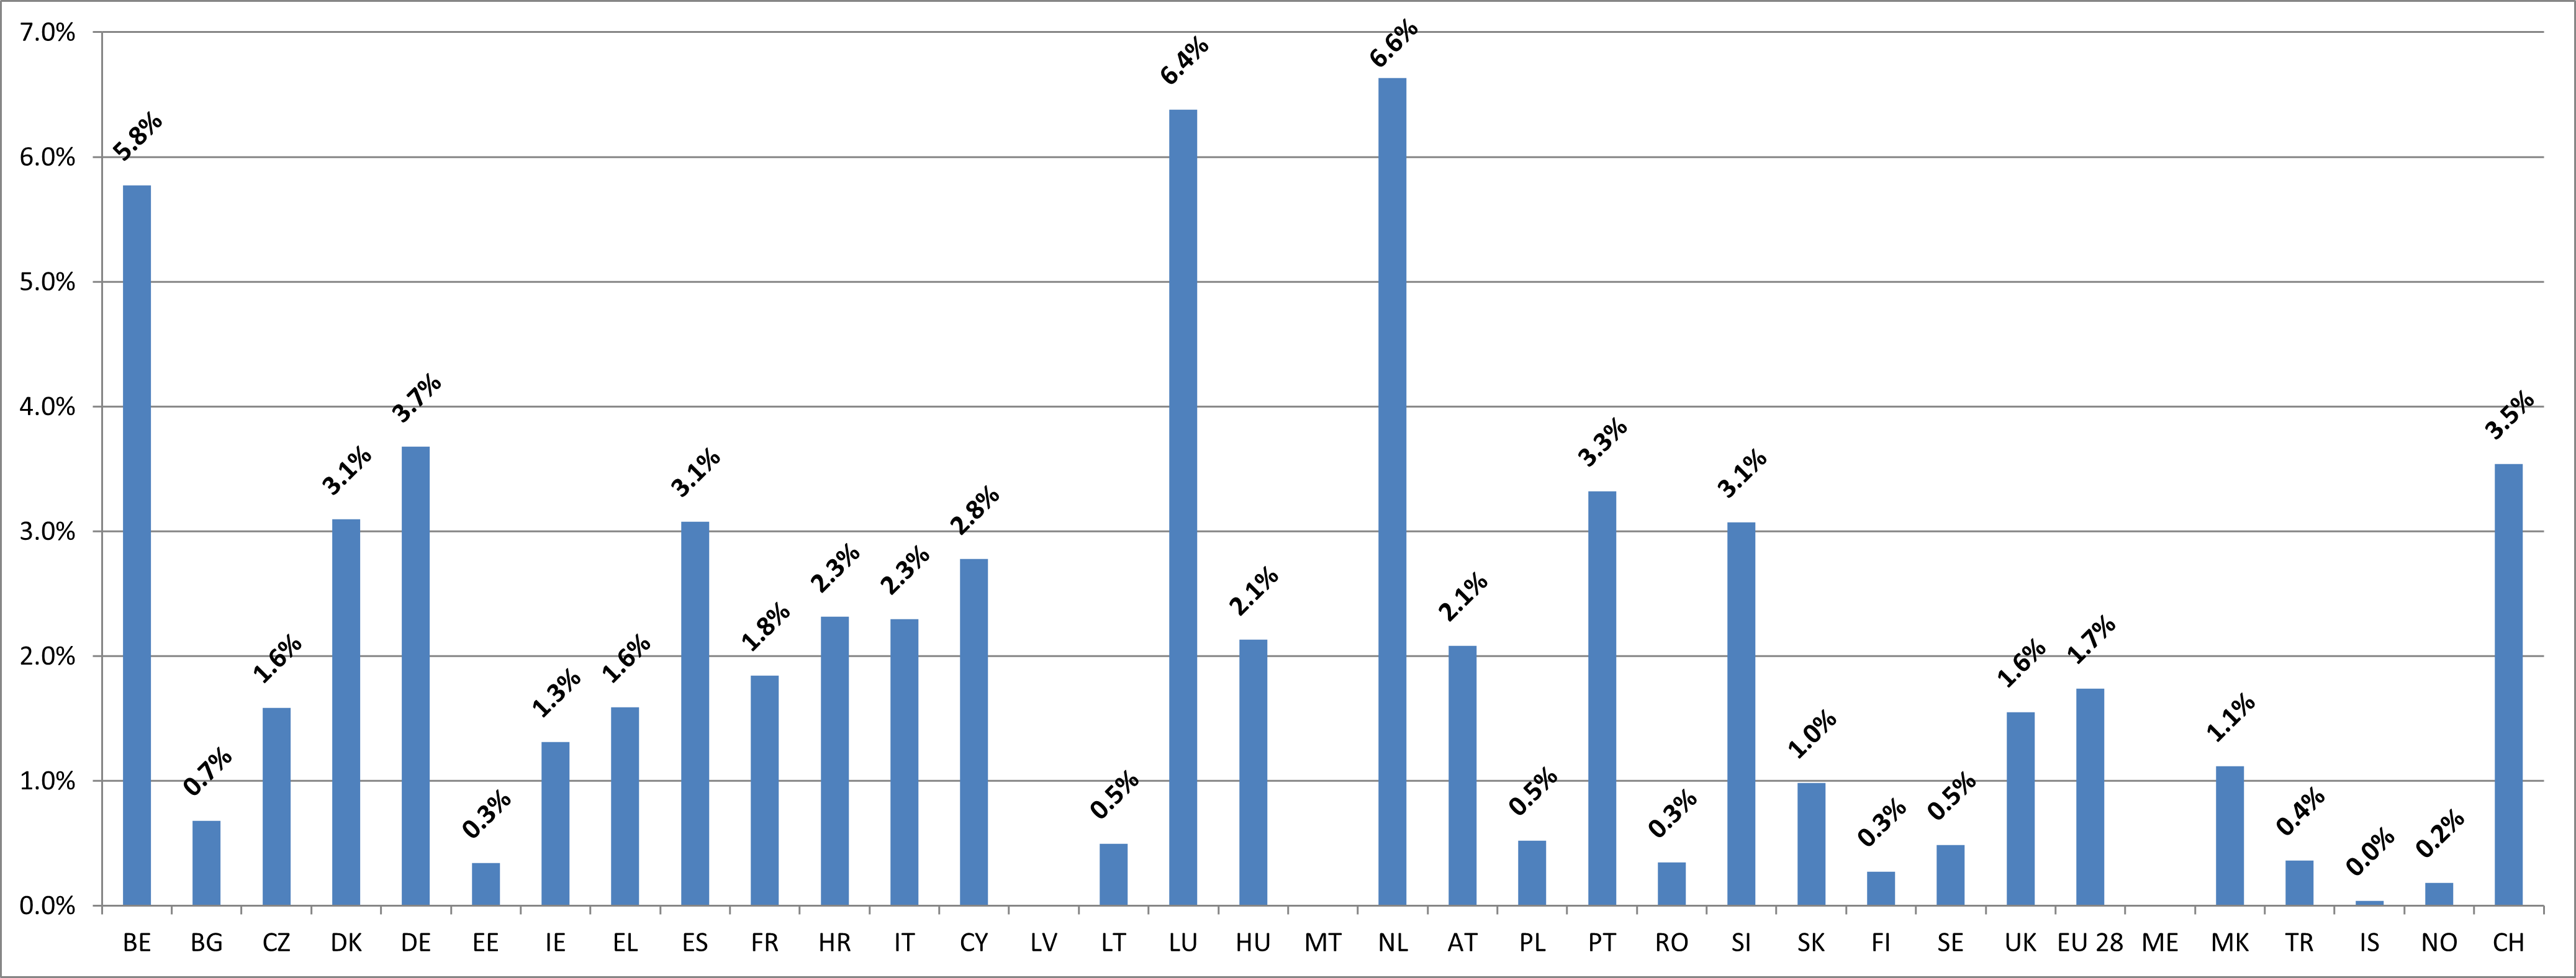
2.6 Density of motorways in EU countries, 2018 (km motorway per 100 km² land area)
Source: Eurostat, EC
EL end of 2010
UK 1st Apri,2014
IS end of 2011
MT end of 2012
2.7 Passenger cars per km of motorway in EU countries, 2018
Source: Eurostat, EC, UNECE statistical database
Notes:
Stock at end of year, except for BE: 1 August (1 July in 2012), CH: 30 September, LI: 1 July.
Taxis are usually included.
HR: from 2009 light vans are included in passenger cars and no longer in Goods Vehicles
FR: include private cars < 15 years old
2.8 Transport network Comparison between EU 27, USA, Japan, Russia and China, 2018 (thousand km)
| EU 27 | USA (1) | Japan (2) | China | Russia | |
| Road network (paved) |
4.930 | 4.577 | 1.006 | 4.466 | 1.171 |
| Motorway network | 73,8 | 99,0 | 9,0 | 142,6 | 54,2 |
| Railway network | 200,6 | 202,5 | 19,3 | 131,7 | 86,6 |
| Electrified rail lines | 111,6 | 11,7 | 75,9 | 44,1 |
Source: Chapter 2.5, 2.6 and 2.7, International Transport Forum (fatalities data for JP, RU all data) , Union Internationale des Chemins de Fer (JP, CN), national statistics (CN, JP, US), estimates (in italics)
Notes:
(1): Divided highways with 4 or more lanes (rural or urban interstate, freeways, expressways, arterial and collector) with full access control by the authorities.
(2): Japan: national expressways.
(3): USA: a sum of partly overlapping networks.
(4): China: both oil and gas pipelines
(5): USA: light duty vehicles, short wheel and long wheel base.
(6): Japan: ordinary, small and light four-wheeled vehicles.
(7): Japan: including 8.3 million light motor vehicles.
2.9 Density of motorways Comparison between EU 27, USA, Japan, Russia and China, 2018 (km motorway per km² land area)
Source: EC, IRF
EU-27: area, population: including French overseas departments.
2.10 Passenger cars per km of motorway. Comparison between EU 27, USA, Japan, Russia and China, 2018
Source: Eurostat, International Road Federation, International Transport Forum, Union Internationale des Chemins de Fer, national statistics
2.11 Cars/1000 person in EU 27, USA, Japan, Russia and China, 2018
Source: EC

