6.1 Transport of passengers by mode in EU 27, 1995-2018 (billion pkm)
| Passenger Cars | P2W | Bus & Coach | Railway | Tram & Metro | Air | Sea | Total | |
| 1995 | 3 284 | 108 | 468 | 313 | 64 | 237 | 26 | 4 500 |
| 1996 | 3 343 | 110 | 473 | 315 | 65 | 251 | 26 | 4 584 |
| 1997 | 3 412 | 114 | 476 | 313 | 65 | 267 | 26 | 4 673 |
| 1998 | 3 507 | 118 | 478 | 312 | 66 | 280 | 26 | 4 787 |
| 1999 | 3 611 | 121 | 479 | 317 | 67 | 291 | 25 | 4 912 |
| 2000 | 3 660 | 99 | 496 | 339 | 68 | 313 | 25 | 5 001 |
| 2001 | 3 734 | 103 | 496 | 340 | 69 | 311 | 25 | 5 077 |
| 2002 | 3 789 | 105 | 493 | 332 | 69 | 305 | 26 | 5 119 |
| 2003 | 3 826 | 108 | 496 | 327 | 70 | 317 | 26 | 5 169 |
| 2004 | 3 878 | 111 | 500 | 332 | 72 | 338 | 25 | 5 257 |
| 2005 | 3 839 | 115 | 498 | 340 | 73 | 361 | 25 | 5 250 |
| 2006 | 3 875 | 114 | 498 | 349 | 75 | 376 | 25 | 5 312 |
| 2007 | 3 921 | 110 | 508 | 353 | 76 | 392 | 24 | 5 385 |
| 2008 | 3 932 | 114 | 514 | 367 | 79 | 384 | 28 | 5 419 |
| 2009 | 4 009 | 112 | 490 | 359 | 79 | 363 | 23 | 5 435 |
| 2010 | 3 976 | 114 | 482 | 358 | 81 | 378 | 21 | 5 410 |
| 2011 | 3 944 | 117 | 486 | 364 | 81 | 409 | 19 | 5 420 |
| 2012 | 3 846 | 117 | 482 | 367 | 82 | 402 | 18 | 5 314 |
| 2013 | 3 903 | 117 | 480 | 372 | 82 | 405 | 18 | 5 377 |
| 2014 | 3 956 | 119 | 476 | 376 | 82 | 425 | 19 | 5 452 |
| 2015 | 4 051 | 119 | 486 | 382 | 83 | 451 | 18 | 5 589 |
| 2016 | 4 156 | 120 | 490 | 387 | 85 | 491 | 22 | 5 750 |
| 2017 | 4 210 | 114 | 470 | 401 | 86 | 536 | 21 | 5 838 |
| 2018 | 4 244 | 108 | 475 | 407 | 89 | 569 | 23 | 5 916 |
| 1995 -2018 | 29,2% | -0,0% | 1,4% | 30,2% | 40,2% | 140,0% | -11,1% | 31,5% |
| per year | 1,1% | -0,0% | 0,1% | 1,2% | 1,5% | 3,9% | -0,5% | 1,2% |
| 2000-2018 | 15,9% | 9,0% | -4,4% | 20,3% | 31,9% | 81,7% | -5,4% | 18,3% |
| per year | 0,8% | 0,5% | -0,2% | 1,0% | 1,5% | 3,4% | -0,3% | 0,9% |
| 2017-2018 | 0,8% | -4,8% | 1,0% | 1,6% | 3,5% | 6,2% | 9,4% | 1,3% |
Source: EC
Notes:
Air and Sea: only domestic and intra-EU-27 transport; estimates for air and for sea based on Eurostat data. The time series for maritime activity from 1995 to 2004 and for aviation activity from 1995 to 2007 have been recalibrated by DG MOVE in line with the new EU-27 figures to avoid break in series.
P2W: Powered two-wheelers
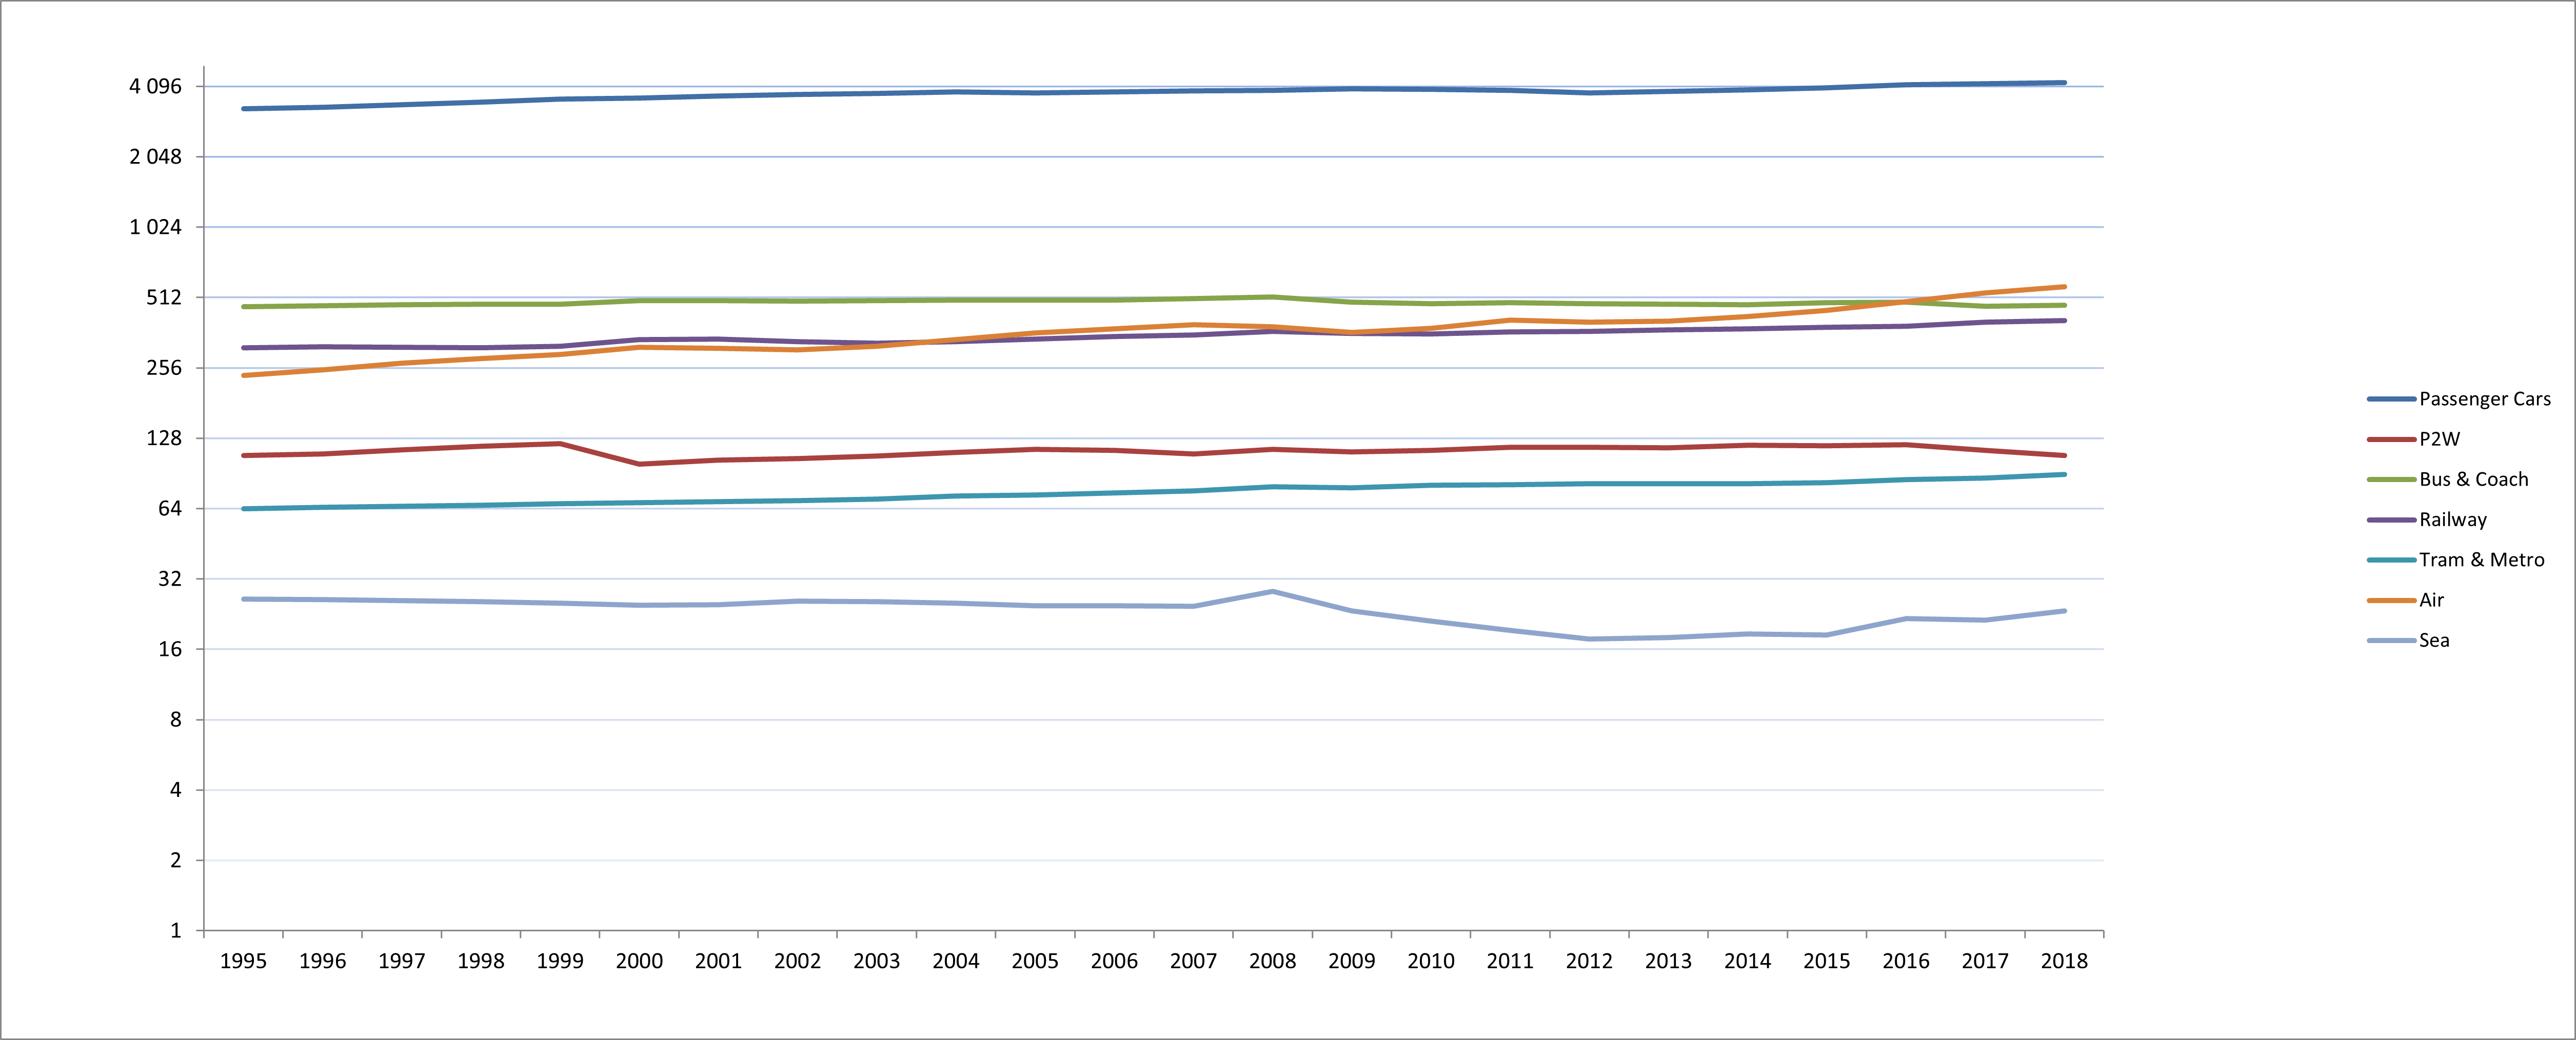
6.2 Evolution of passenger transport by mode in EU 27, 1995-2018
Source: EC
Notes :
Air and Sea: only domestic and intra-EU-27 transport; estimates for air and for sea based on Eurostat data. The time series for maritime activity from 1995 to 2004 and for aviation activity from 1995 to 2007 have been recalibrated by DG MOVE in line with the new EU-27 figures to avoid break in series.
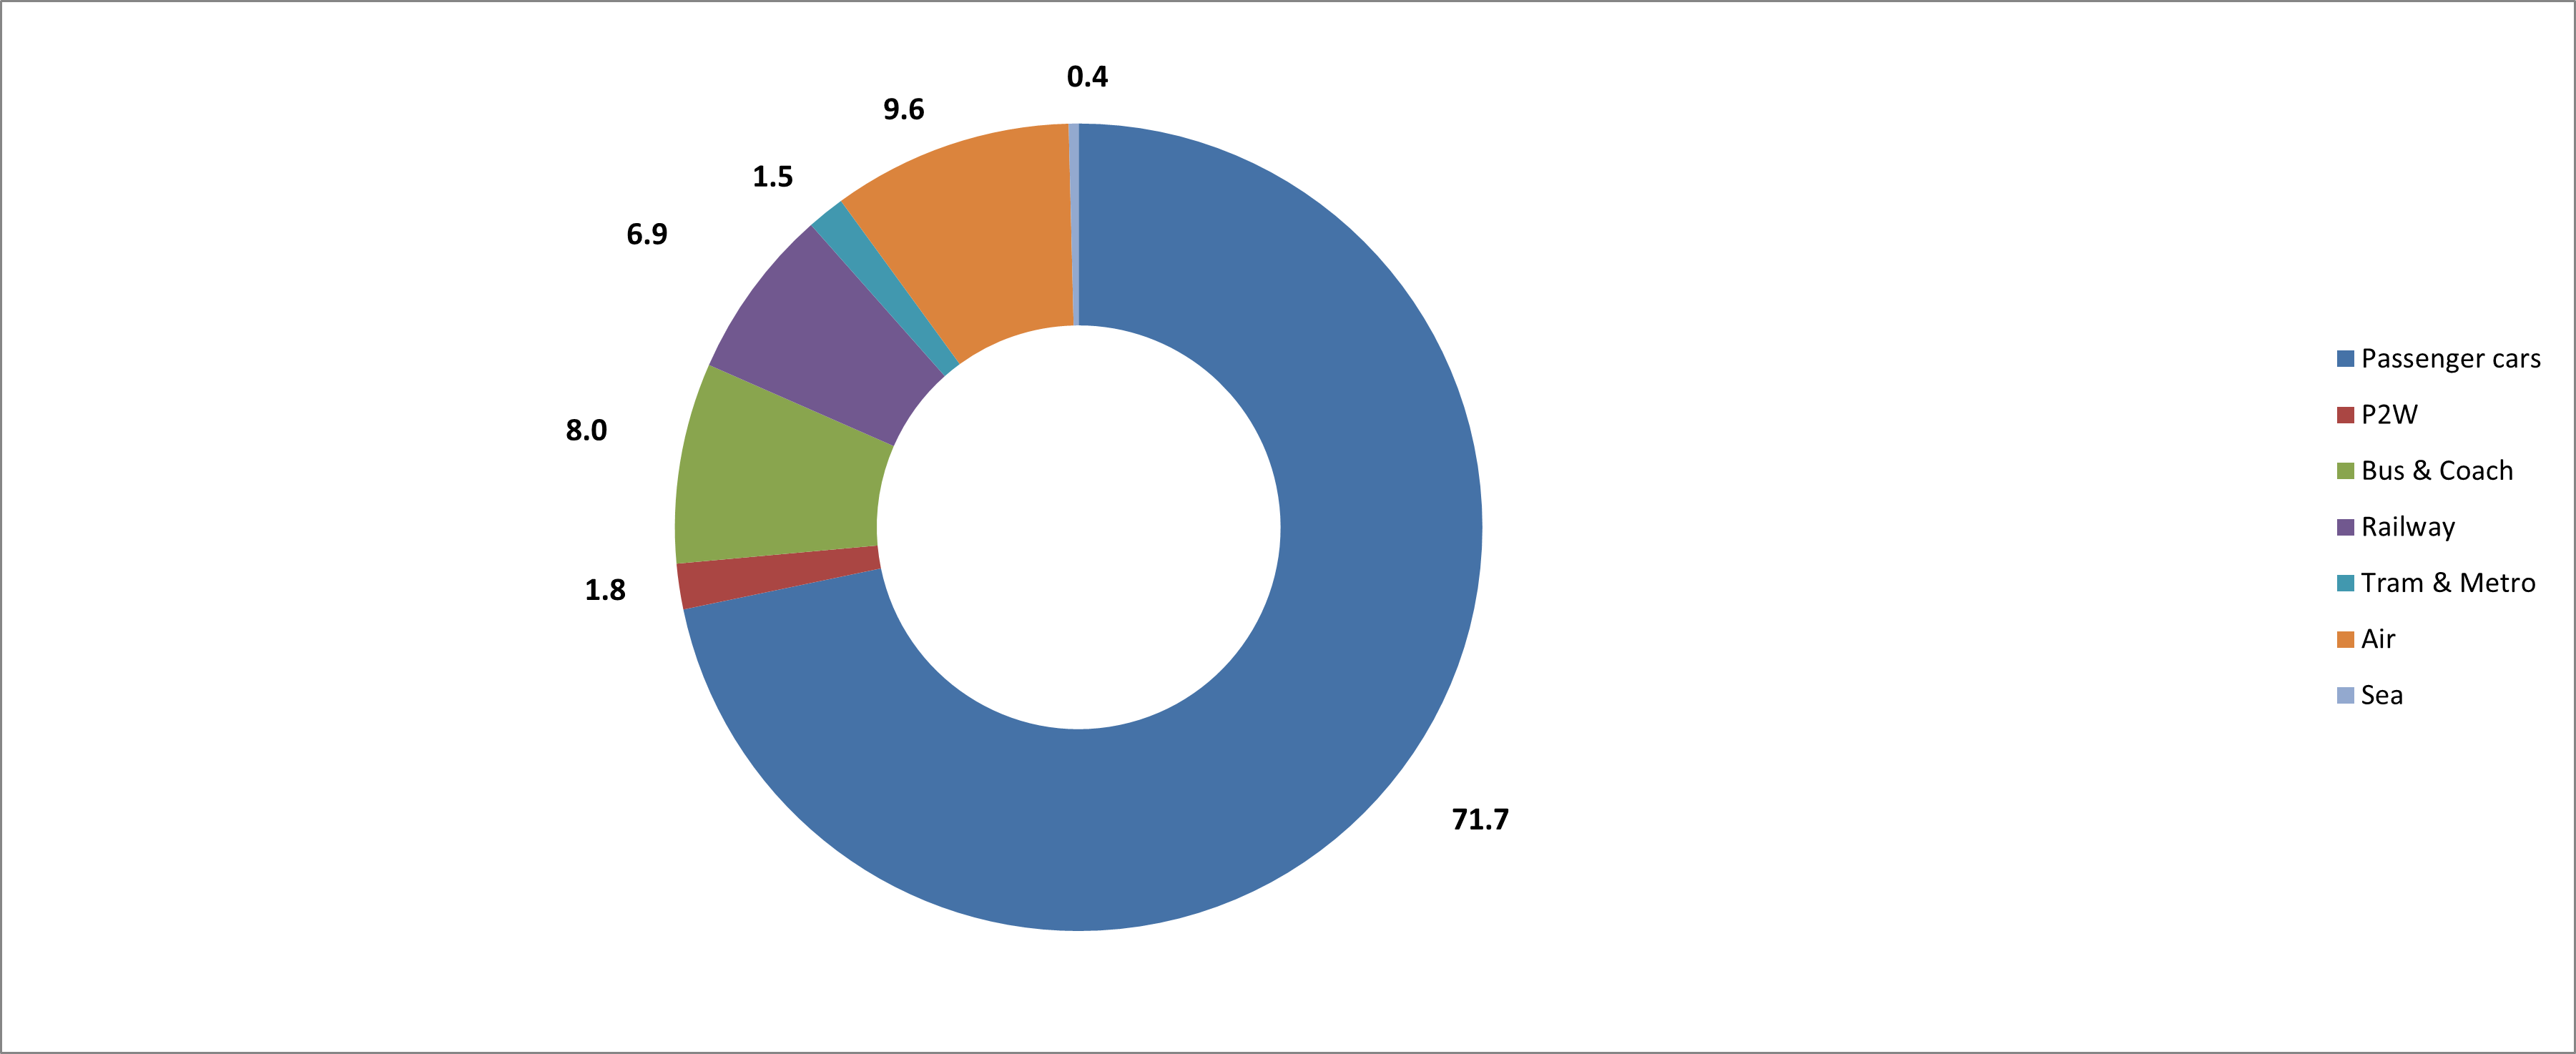
6.3 Passenger transport modal split in EU 27, 2018 (pkm in %)
Source: EC
Notes
Air and Sea: only domestic and intra-EU-27 transport; estimates for air and for sea based on Eurostat data. The time series for maritime activity from 1995 to 2004 and for aviation activity from 1995 to 2007 have been recalibrated by DG MOVE in line with the new EU-27 figures to avoid break in series.
P2W: Powered two-wheelers
6.4 Modal split of passenger transport on land by country in EU countries, 2018 ( billion pkm and pkm in %)
| Passenger cars* (billion pkm) |
Passenger cars (%) | Buses and coaches (billion pkm) |
Buses and coaches (%) | Railways (billion pkm) |
Railways (%) | Urban rail* (tram & metro) (billion pkm) |
Urban rail (tram & metro) (%) |
TOTAL (billion pkm) |
|
| BE | 107,3 | 80,72 | 13,5 | 10,17 | 10,7 | 8,06 | 1,4 | 0,01 | 132,95 |
| BG | 57,2 | 82,14 | 9,9 | 14,18 | 1,5 | 2,12 | 1,1 | 0,02 | 69,70 |
| CZ | 78,0 | 66,61 | 18,1 | 15,48 | 10,2 | 8,73 | 10,7 | 0,09 | 117,05 |
| DK | 60,7 | 81,64 | 7,1 | 9,56 | 6,2 | 8,33 | 0,4 | 0,00 | 74,39 |
| DE | 920,2 | 83,78 | 62,5 | 5,69 | 98,1 | 8,93 | 17,6 | 0,02 | 1.098,40 |
| EE | 13,3 | 79,97 | 2,8 | 16,71 | 0,4 | 2,50 | 0,1 | 0,01 | 16,68 |
| IE | 57,2 | 81,36 | 10,5 | 14,94 | 2,3 | 3,25 | 0,3 | 0,00 | 70,26 |
| EL | 103,4 | 81,58 | 20,5 | 16,21 | 1,1 | 0,87 | 1,7 | 0,01 | 126,74 |
| ES | 340,6 | 83,08 | 32,2 | 7,85 | 28,4 | 6,93 | 8,7 | 0,02 | 409,89 |
| FR | 757,1 | 82,06 | 57,6 | 6,24 | 97,1 | 10,53 | 10,8 | 0,01 | 922,54 |
| HR | 25,6 | 83,21 | 3,8 | 12,49 | 0,7 | 2,43 | 0,6 | 0,02 | 30,76 |
| IT | 722,9 | 81,39 | 103,0 | 11,59 | 55,5 | 6,25 | 6,9 | 0,01 | 888,22 |
| CY | 6,8 | 81,10 | 1,6 | 18,90 | – | – | 8,38 | ||
| LV | 15,3 | 84,00 | 2,2 | 11,87 | 0,6 | 3,44 | 0,1 | 0,01 | 18,16 |
| LT | 30,1 | 90,41 | 2,8 | 8,52 | 0,4 | 1,06 | – | 33,31 | |
| LU | 7,8 | 82,92 | 1,2 | 12,39 | 0,4 | 4,69 | 0,2 | 9,45 | |
| HU | 63,9 | 68,54 | 18,9 | 20,22 | 7,8 | 8,33 | 2,7 | 0,03 | 93,29 |
| MT | 2,7 | 82,47 | 0,6 | 17,53 | – | – | 3,24 | ||
| NL | 144,7 | 85,17 | 5,3 | 3,09 | 18,9 | 11,12 | 1,0 | 0,01 | 169,89 |
| AT | 78,5 | 71,93 | 10,3 | 9,40 | 13,2 | 11,40 | 7,2 | 0,07 | 109,20 |
| PL | 212,4 | 77,99 | 34,5 | 12,68 | 21,0 | 6,70 | 4,4 | 0,02 | 272,36 |
| PT | 95,5 | 87,47 | 7,9 | 7,26 | 4,6 | 4,10 | 1,2 | 0,01 | 109,13 |
| RO | 103,8 | 75,21 | 19,9 | 14,44 | 5,6 | 4,50 | 8,7 | 0,06 | 138,02 |
| SI | 27,5 | 86,43 | 3,8 | 11,78 | 0,6 | 2,50 | – | 31,83 | |
| SK | 28,5 | 73,40 | 6,2 | 16,09 | 3,8 | 7,00 | 0,3 | 0,01 | 38,77 |
| FI | 66,8 | 83,51 | 8,0 | 10,00 | 4,5 | 5,20 | 0,7 | 0,01 | 79,99 |
| SE | 116,0 | 81,54 | 10,0 | 7,02 | 13,5 | 8,90 | 2,7 | 0,02 | 142,27 |
| UK | 672,7 | 84,80 | 36,8 | 4,63 | 69,7 | 8,00 | 14,1 | 0,02 | 793,28 |
| EU 28 | 4916,53 | 81,83% | 511,38 | 8,51% | 476,89 | 7,94% | 103,55 | 1,72% | 6.008,35 |
Source: national statistics, International Transport Forum, Eurostat, estimates, study for DG Energy and Transport
Notes:
Data is not harmonised and therefore not fully comparable. 2018 data may be provisional. Data sometimes includes activity of foreign vehicles performed within the country, therefore EU aggregates might be affected by double-counting. Generally vans are not considered in this table, but there may be exceptions.
FR: passenger-km include transport activity on the territory of vehicles not registered in France. Includes foreign vans.
UK: data refer to Great Britain only; include pkm by vans
DE: includes DE-E: 1970=24.5, 1980=56.0, 1990=90.3
DK: figures exclude activity of vans with a mass higher than 2000 kg.
PL: estimated activity
6.5 Passenger vehicles in EU and selected countries, 2018
| Stock of registered passenger cars (thousand) |
Stock of registered PTW (thousand) |
Stock of registered buses & coaches (thousand) | |
| BE | 58.68,59 | 649,22 | 16,17 |
| BG | 27.73,33 | 190,00 | 20,82 |
| CZ | 5.748,00 | 1.132,08 | 22,03 |
| DK | 2.594,47 | 199,23 | 13,16 |
| DE | 47.095,78 | 4.438,60 | 80,52 |
| EE | 746,50 | 54,50 | 5,00 |
| IE | 2.127,83 | 40,20 | 10,94 |
| EL | 5.406,55 | 1.609,92 | 26,48 |
| ES | 24.074,15 | 5.393,20 | 64,91 |
| FR | 32.034,00 | 3.034,00 | 100,71 |
| HR | 1.666,41 | 157,36 | 5,88 |
| IT | 39.018,17 | 9.354,74 | 100,04 |
| CY | 550,70 | 39,76 | 3,08 |
| LV | 693,39 | 55,90 | 4,63 |
| LT | 1.430,52 | 45,27 | 7,52 |
| LU | 415,15 | 30,64 | 2,04 |
| HU | 3.641,82 | 176,07 | 19,13 |
| MT | 300,14 | 27,33 | 2,11 |
| NL | 8.530,58 | 1.895,92 | 9,72 |
| AT | 4.978,85 | 847,36 | 10,04 |
| PL | 23.429,00 | 2.852,80 | 119,00 |
| PT | 5.282,97 | 616,08 | 15,49 |
| RO | 6.452,54 | 136,44 | 51,80 |
| SI | 1.143,15 | 130,94 | 2,83 |
| SK | 2.321,61 | 140,45 | 9,07 |
| FI | 3.494,84 | 613,74 | 18,52 |
| SE | 4.870,78 | 673,72 | 14,38 |
| UK | 32.493,30 | 1.265,10 | 112,10 |
| EU 28 | 26.9183,11 | 35.800,54 | 868,12 |
| ME | 206,45 | 5,70 | 1,46 |
| MK | 415,06 | 13,34 | 3,20 |
| AL | 460,03 | 33,66 | 7,15 |
| RS | 1.999,77 | 64,90 | 9,88 |
| TR | 12.398,19 | 3.211,33 | 706,05 |
Source: EC
Notes:
National vehicle stock data do not always include all powered two-wheelers and are therefore not fully comparable between countries.
Tricycles and quads are sometimes included in the data.
Data include buses, coaches, minibuses and sometimes also trolleybuses.
Taxis are usually included.
Stock at end of year, except for BE: 1 August
FR: include private cars < 15 years old
6.6 Motorisation in EU and selected countries, 2018
| Motorisation* | |
| BE | 512 |
| BG | 396 |
| CZ | 540 |
| DK | 447 |
| DE | 567 |
| EE | 563 |
| IE | 434 |
| EL | 504 |
| ES | 513 |
| FR | 478 |
| HR | 409 |
| IT | 646 |
| CY | 629 |
| LV | 361 |
| LT | 512 |
| LU | 676 |
| HU | 373 |
| MT | 608 |
| NL | 494 |
| AT | 562 |
| PL | 617 |
| PT | 514 |
| RO | 332 |
| SI | 549 |
| SK | 426 |
| FI | 633 |
| SE | 476 |
| UK | 488 |
| EU28 | 524 |
| ME | 332 |
| MK | 200 |
| AL | 161 |
| RS | 287 |
| TR | 151 |
Source: EC
Notes:
*number of passenger cars per 1.000 inhabitants
Passenger car stock at end of year n divided by the population on 1 January of year n+1
6.7 Passenger cars per 1.000 inhabitants in EU countries, 2019
| Motorisation* | |
| BE | 511 |
| BG | 407 |
| CZ | 554 |
| DK | 455 |
| DE | 574 |
| EE | 598 |
| IE | 454 |
| EL | 504 |
| ES | 519 |
| FR | 482 |
| HR | 425 |
| IT | 663 |
| CY | 645 |
| LV | 381 |
| LT | 536 |
| LU | 681 |
| HU | 390 |
| MT | 597 |
| NL | 499 |
| AT | — |
| PL | 642 |
| PT | 530 |
| RO | 357 |
| SI | 556 |
| SK | 439 |
| FI | 642 |
| SE | 473 |
Source: Eurostat
*number of passenger cars per 1.000 inhabitants
6.8 Motorcycle registrations in EU countries, 2010-2019
| 2010 | 2011 | 2012 | 2013 | 2014 | 2015 | 2016 | 2017 | 2018 | 2019 | |
| AT | 21.510 | 22.750 | 24.808 | 26.020 | 25.192 | 24.891 | 29.763 | 24.893 | 25.955 | 27.654 |
| BE | 24.270 | 25.043 | 23.921 | 20.648 | 20.681 | 21.577 | 23.621 | 21.390 | 23.932 | 24.205 |
| BG | – | – | 127 | 173 | 116 | 169 | – | – | – | – |
| CY | – | – | – | – | – | – | – | – | – | – |
| CZ | – | – | – | 12.102 | 12.442 | 13.424 | 14.086 | 12.330 | 13.943 | 15.134 |
| DE | 122.394 | 127.009 | 127.603 | 129.756 | 141.623 | 151.661 | 174.624 | 140.667 | 156.110 | 166.676 |
| DK | 3.258 | 2.032 | 1.983 | 1.869 | 1.936 | 2.417 | 3.139 | 2.806 | – | – |
| EE | 244 | 299 | 364 | 409 | 449 | 489 | 609 | 511 | 595 | 721 |
| EL | 59.638 | 44.785 | 31.805 | 28.522 | 30.951 | 32.468 | 38.632 | 27.473 | 32.575 | 37.168 |
| ES | 134.297 | 119.438 | 97.944 | 92.409 | 111.463 | 132.539 | 155.004 | 136.180 | 159.872 | 177.037 |
| FI | 6.054 | 5.692 | 4.986 | 3.967 | 3.467 | 3.157 | 3.022 | 2.829 | 3.203 | 3.323 |
| FR | 198.086 | 185.122 | 169.644 | 148.203 | 153.324 | 153.242 | 163.335 | 162.808 | 177.247 | 197.470 |
| HR | – | – | – | – | 1.510 | 1.511 | 1.811 | 2.216 | 2.779 | 3.237 |
| HU | 2.453 | 2.091 | 1.957 | 1.989 | 1.886 | 2.093 | 2.204 | 2.274 | 3.051 | 4.061 |
| IE | 1.042 | 831 | 663 | 441 | 800 | 1.022 | 1.470 | 1.311 | 1.371 | 1.718 |
| IT | 306.307 | 254.906 | 206.303 | 154.100 | 156.539 | 172.066 | 195.405 | 204.579 | 219.744 | 231.712 |
| LT | 230 | 281 | 224 | 241 | 294 | 294 | 390 | 367 | 414 | 557 |
| LU | 1.255 | 1.306 | 1.201 | 1.566 | 1.734 | 1.654 | 1.783 | 1.838 | 2.006 | 2.130 |
| LV | 278 | 472 | 494 | 477 | 589 | 595 | 642 | 624 | 791 | 1.022 |
| MT | – | – | – | – | – | – | – | – | – | – |
| NL | 12.848 | 11.660 | 10.611 | 9.570 | 10.667 | 11.673 | 12.855 | 13.057 | 13.474 | 14.378 |
| PL | 8.719 | 8.957 | 7.760 | 7.394 | 9.848 | 23.865 | 25.823 | 15.025 | 14.550 | 19.200 |
| PT | 18.896 | 18.937 | 17.180 | 14.594 | 15.424 | 17.611 | 19.760 | 24.809 | 28.326 | 29.857 |
| RO | 558 | 469 | 555 | 521 | 593 | 648 | 952 | 1.115 | 1.525 | 2.159 |
| SE | 9.023 | 8.219 | 7.602 | 7.780 | 8.378 | 9.422 | 13.220 | 9.716 | 2.347 | 2.333 |
| SK | 2.018 | 1.660 | 1.643 | 1.292 | 1.707 | 1.855 | 2.074 | 2.269 | 5.280 | 5.745 |
| SI | – | 1.960 | 1.920 | 2.840 | – | 5.309 | 5.565 | 4.923 | 10.367 | 10.754 |
| UK | 81.397 | 79.721 | 80.874 | 81.646 | 91.509 | 105.717 | 119.889 | 97.713 | 100.411 | 101.273 |
| EU 28 | 1.029.160 | 935.562 | 822.172 | 748.529 | 803.122 | 891.369 | 1.009.678 | 913.723 | 999.868 | 1.079.524 |
Source: ACEM
6.9 Transport of passengers per mode - Comparison EU 27/World
| Passenger transport | EU 27 (2018) | USA (2018) | Japan (2017) | China (2018) | Russia (2018) | ||
| (billion pkm) | |||||||
| Passenger car | 4.243,8 | 7.804,1 | – | 928,0 | – | ||
| Bus, trolley-bus and coach | 474,6 | 624,7 | 69,8 | – | 122,5 | ||
| Railway | 407,2 | 37,5 | 437 | 1.414,7 | 129,5 | ||
| Tram and metro | 89,5 | 24,6 | – | – | 48,4 | ||
| Waterborne | 23,4 | 0,8 | 3,3 | 8,0 | 0,7 | ||
| Air (domestic/intra EU) | 569,3 | 1.175,5 | 102,0 | 1.071,2 | 259,4 | ||
Source: Eurostat, Japan Statistics Bureau, US Bureau of Transportation Statisitics, Goskom STAT (Russia), National Bureau of Statistics of China, International Transport Forum, estimates (in italics)
Notes:
USA: Including light trucks / vans
China: passenger-kilometers of highways including buses and coaches
Japan: included in railway pkm
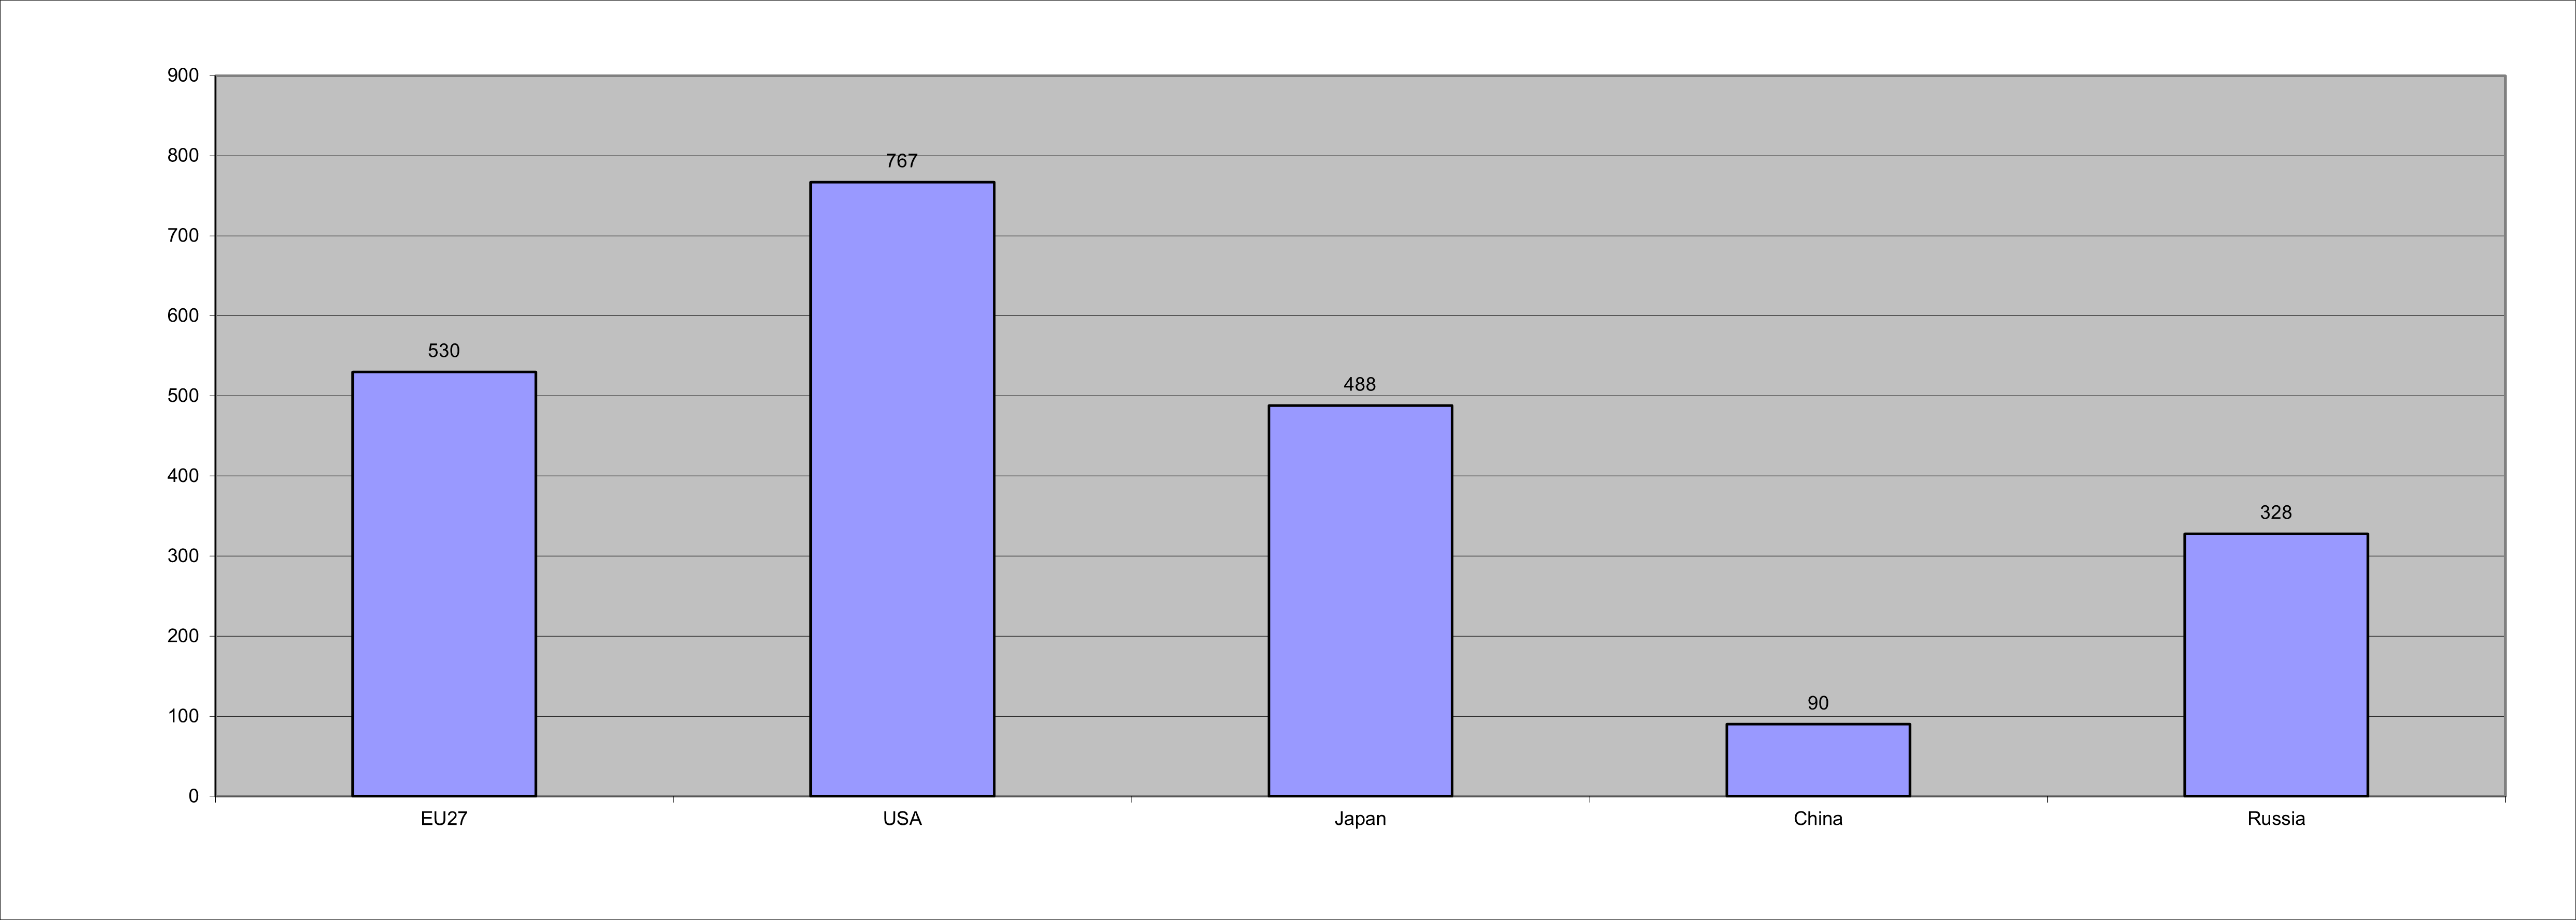
6.10 Motorisation: Comparison EU 27/World, 2018 ( cars/1000 inhabitants)
Source: EC
Japan: 2017 data
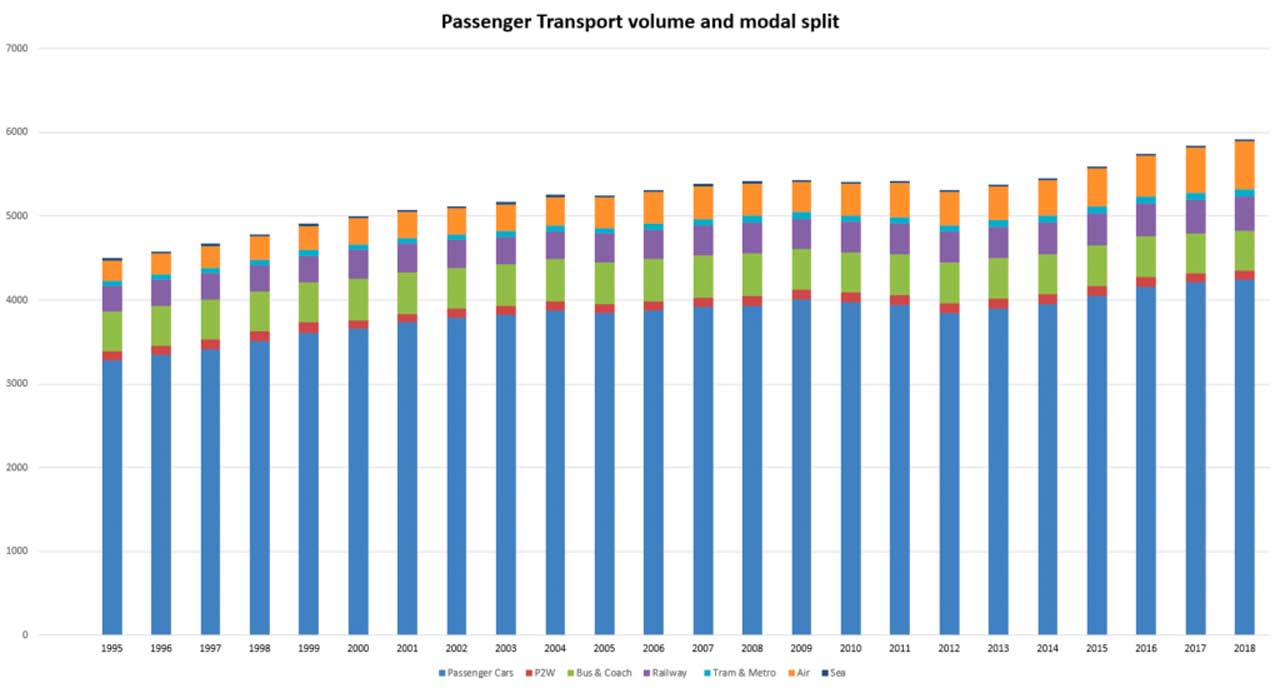
6.11 Passenger Transport volume and modal split 1995-2018 in EU27 ( Billion passenger-kilometres)
Source: EC
Japan: 2017 data


